UNITED STATES
SECURITIES AND EXCHANGE COMMISSION
Washington, D.C. 20549
SCHEDULE 14A
(RULE 14a-101)
SCHEDULE 14A INFORMATION
Proxy Statement Pursuant to Section 14(a) of
the Securities Exchange Act of 1934 (Amendment No. )
Filed by the Registrant ☑
Filed by a Party other than the Registrant ☐ Check the appropriate box:
Chemed Corporation (Name of Registrant as Specified In Its Charter) (Name of Person(s) Filing Proxy Statement, if other than the Registrant) Payment of Filing Fee (Check the appropriate box):
NOTICE OF ANNUAL MEETING OF STOCKHOLDERS MAY The Annual Meeting of Stockholders of Chemed Corporation will be held at
The above matters are described in the Proxy Statement accompanying this Notice. You are urged, after reading the Proxy Statement, to vote your shares by proxy by either: (a) completing, signing, dating and returning your proxy card in the postage-paid envelope provided, or (b) voting by telephone, or (c) voting via the Internet using the instructions on your proxy card. Voting instructions are described in more detail in the Proxy Statement. Your vote is extremely important. If you have any questions or require any assistance with voting your shares, please contact the Board of Directors’ proxy solicitor: Innisfree M&A Incorporated Stockholders Toll-Free: Banks and Stockholders of record at the close of business on March
April Table of Contents
Consideration of the Following our
Management maintains a policy of soliciting feedback in connection with the Say On Pay vote and changes to the executive compensation program from a number of its largest stockholders. The Compensation Committee and the Board believe that our executive compensation program provides our executive officers with a balanced compensation package that includes a reasonable base salary along with annual and long-term incentive compensation plans that are based on the Company’s financial performance. We believe the shareholder approval in On a periodic basis, the Company’s executive compensation consultant provides the Compensation Committee with a review of executive compensation. The most recent review included base salary, annual bonus, and long-term incentives for The following chart summarizes both Chemed’s Adjusted EPS and stock price performance since 2003. 1 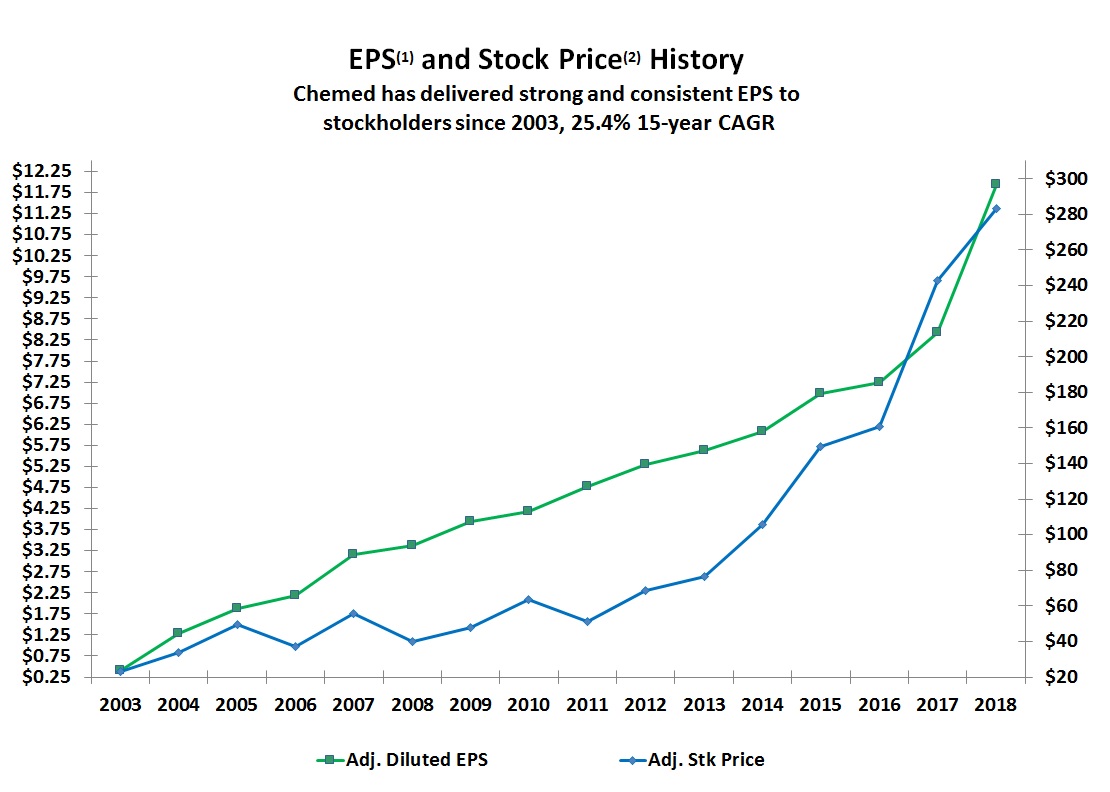 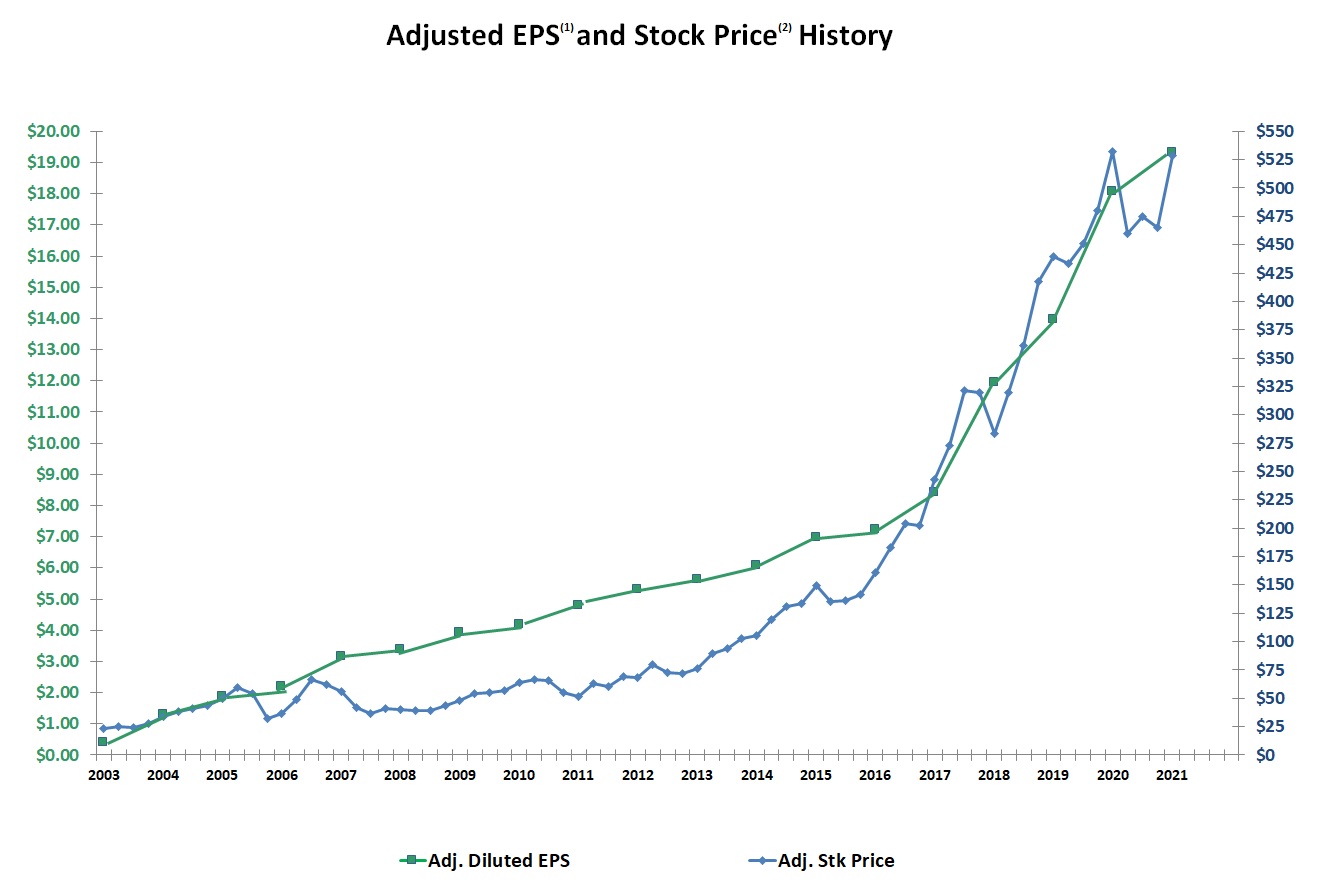
2
3 PROXY STATEMENT This Proxy Statement and the accompanying proxy card are furnished in connection with the solicitation by the Board of Directors (the “Board” or the “Board of Directors”) of Chemed Corporation (the “Company” or “Chemed”) of proxies to be used at the Annual Meeting of Stockholders of the Company to be held at 11:00 a.m. Eastern Time on May 16, 2022 at The Queen City Club, 331 East Fourth Street, Cincinnati, Ohio The Board unanimously recommends that you vote FOR the election of each of the Board’s nominees named on the proxy card accompanying this Proxy Statement. Please read “How to Vote” for more information on how to vote your proxy. STOCKHOLDERS ENTITLED TO VOTE Stockholders as recorded in the Company’s stock register on March QUORUM The Company’s bylaws provide that at all meetings of stockholders, the holders of record, present in person or by proxy, of shares of Capital Stock having a majority of the voting power entitled to vote thereat, is necessary and sufficient to constitute a quorum for the transaction of business. Abstentions and shares held of record by a broker or its nominee that are voted on any matter are included in determining the number of votes present. Broker shares that are not voted on any matter at the Annual Meeting will not be included in determining whether a quorum is present. Your vote is important – we urge you to vote by proxy even if you plan to attend the Annual Meeting. 4 VOTE REQUIREMENTS
| |||||||||||||||||||||||||||||||||||||||||||||||||||||||||||||||||||||||||||||||||||||||||||||||||||||||||||||||||||||||||||||||||||||||||||||||||||||||||||||||||||||||||||||||||||||||||||||||||||||||||||||||||||||||||||||||||||||||||||||||||||||||||||||||||||||||||||||||||||||||||||||||||||||||||||||||||||||||||||||||||||||||||||||||||||||||||||||||||||||||||||||||||||||||||||||||||||||||||||||||||||||||||||||||||||||||||||||||||||||||||||||||||||||||||||||||||||||||||||||||||||||||||||||||||||||||||||||||||||||||||||||||||||||||||||||||||||||||||||||||||||||||||||||||||||||||||||||||||||||||||||||||||||||||||||||||||||||||||||||||||||||||||||||||||||||||||||||||||||||||||||||||||||||||||||||||||||||||||||||||||||||||||||||||||||||||||||||||||||||||||||||||||||||||||||||||||||||||||||||||||||||||||||||||||||||||||||||||||||||||||||||||||||||||||||||||||||||||||||||||||||||||||||||||||||||||||||||||||||||||||||||||||||||||||||||||||||||||||||||||||||||||||||||||||||||||||||||||||||||||
HOW TO VOTE; SUBMITTING YOUR PROXY; REVOKING YOUR PROXY
You may vote your shares either by voting in person at the Annual Meeting or by submitting a completed proxy. By submitting a proxy, you are legally authorizing another person to vote your shares. The enclosed proxy card designates Messrs. McNamara and Walsh to vote your shares in accordance with the voting instructions you indicate on your proxy card.
If you submit your executed proxy card designating Messrs. McNamara and Walsh as the individuals authorized to vote your shares, but you do not indicate how your shares are to be voted, then your shares will be voted by these individuals in accordance with the Board’s recommendations, which are described in this Proxy Statement. In addition, if any other matters are properly brought up at the Annual Meeting (other than the proposals contained in this Proxy Statement), then each of these individuals will have the authority to vote your shares on those other matters in accordance with his or her discretion and judgment. The Board currently does not know of any matters to be raised at the Annual Meeting other than the proposals contained in this Proxy Statement.
We urge you to vote by doing one of the following:
| ● | Vote by Mail: You can vote your shares by mail by completing, signing, dating and returning your proxy card in the postage-paid envelope provided. In order for your proxy to be validly submitted and for your shares to be voted in accordance with your instructions, we must receive your mailed proxy card by |
| ● | Vote by Telephone: You can also vote your shares by calling the number (toll-free in the United States and Canada) indicated on your proxy card at any time and following the recorded instructions. If you submit your proxy by telephone, then you may submit your voting instructions up until 11:59 p.m. Central Time on May |
5
| ● | Vote via the Internet: You can vote your shares via the Internet by going to the |
| ● | Vote at the Annual Meeting: You may request and cast a ballot in person at the Annual Meeting at the appropriate time during the meeting. |
If your shares are not registered in your name but in the “street name” of a bank, broker or other holder of record (a “nominee”), then your name will not appear in the Company’s register of stockholders. Those shares are held in your nominee’s name, on your behalf, and your nominee will be entitled to vote your shares. Your nominee is required to vote your shares in accordance with your instructions. If you do not give instructions to your nominee, your nominee will be entitled to vote your shares with respect to “discretionary” items but will not be permitted to vote your shares with respect to “non-discretionary” items (your shares are treated as “broker non-votes”).
Your proxy is revocable. If you are a stockholder of record, after you have submitted your proxy card, you may revoke it by mail by sending a written notice to be delivered before the Annual Meeting to the Company’s Secretary at Suite 2600, 255 East Fifth Street, Cincinnati, Ohio 45202-4726. If you wish to revoke your submitted proxy card and submit new voting instructions by mail, then you must sign, date and mail a new proxy card with your new voting instructions, which we must receive by 11:59 p.m. Central Time on May 19, 2019.15, 2022. If you are a stockholder of record and you voted your proxy card by telephone or via the Internet, you may revoke your submitted proxy and/or submit new voting instructions by that same method, which we must receive by 11:59 p.m. Central Time on May 19, 2019.15, 2022. You also may revoke your proxy card by attending the Annual Meeting and voting your shares in person. Attending the Annual Meeting without taking one of the actions above will not revoke your proxy. If you are a beneficial owner, or you hold your shares in “street name” as described above, please contact your bank, broker or other holder of record for instructions on how to change or revoke your vote.
Your vote is very important to the Company. If you do not plan to attend the Annual Meeting, we encourage you to read this Proxy Statement and submit your completed proxy card prior to the Annual Meeting in accordance with the above instructions so that your shares will be represented and voted in accordance with your instructions. Even if you plan to attend the Annual Meeting, in person, we recommend that you vote your shares in advance so that your vote will be counted if you later decide not to attend the Annual Meeting.
You are entitled to attend the Annual Meeting only if you are a stockholder of record or a beneficial owner as of the close of business on March 26, 2019,23, 2022, or if you hold a valid proxy for the meeting. You should be prepared to present photo identification for admission.
If your shares are held in “street name”, to attend the Annual Meeting, you must bring a letter or account statement showing that you beneficially own the shares held by your nominee, as well as proper photo identification. Even if you attend the Annual Meeting, you cannot vote the shares that are held by your nominee unless you have a proxy card from your nominee. Rather, you should vote your shares by following the instructions provided on the enclosed proxy card and returning the proxy card to your nominee to ensure that your shares will be voted on your behalf, as described above.
If you have questions or require any assistance with voting your shares, please contact the Board’s proxy solicitor, Innisfree M&A Incorporated: stockholdersstockholders toll-free (888) 750-5834;(877) 800-5194; banks and brokers collect(212) 750-5833.
ELECTION OF DIRECTORS
In the election of directors, every stockholder has the right to vote each share of Capital Stock owned by such stockholder on the record date for as many persons as there are directors to be elected. Ten directors are to be elected at the Annual Meeting to serve until the next Annual Meeting of Stockholders and until their successors are duly elected and qualified in accordance with our bylaws. Cumulative voting is not permitted. To be elected in an uncontested election, each director must receive the affirmative vote of the majority of the votes cast at the Annual Meeting. The number of votes cast “FOR” a nominee’s election must exceed the number of votes cast “AGAINST” his or her election. Abstentions and broker non-votes shall not be counted as votes cast.
6
As required by the Company’s bylaws, each incumbent director nominee has submitted an irrevocable letter of resignation as director that becomes effective if he or she does not receive the affirmative vote of the majority of the votes cast at the Annual Meeting and the Board of Directors accepts the resignation. If an incumbent director is not re-elected, the Nominating Committee will consider the director’s resignation and recommend to the Board of Directors the action to be taken with respect to such resignation. The Board of Directors will decide the action to be taken with respect to such resignation no later than 90 days following the certification of the voting results. The Company will publicly disclose the Board of Directors’ decision within four business days, providing an explanation of the process by which the Board reached their decision and, if applicable, the reason for not accepting the director’s resignation. Any director whose resignation is so evaluated and decided upon will not participate in the Nominating Committee’s recommendation or Board of Directors’ action regarding whether to accept the resignation offer.
NOMINEES
Unless otherwise indicated by your proxy card, if you return a validly completed and executed proxy card or vote your proxy card by telephone or via the Internet, your shares will be voted FOR the nominees named below. Each of theThe ten nominees named below is aare current directordirectors standing for re-election and each waswho were elected at the Annual Meeting of Stockholders held on May 21, 2018.17, 2021. As of the date of this Proxy Statement, the Board has no reason to believe that any of the nominees named below will be unable or unwilling to serve. Each nominee named below has consented to being named in this Proxy Statement and to serve if elected.
The following paragraphs provide information as of the date of this proxy statement about each nominee. As discussed more fully in “Corporate Governance – Committees and Meetings of the Board – Nominating Committee” below, the Board seeks independent directors who represent a mix of backgrounds and experiences that will enhance the quality of the Board’s deliberations and decisions. Candidates shall have substantial experience or shall have achieved a high level of distinction in their fields. Certain individual qualifications and skills of our nominees that contribute to the Board’s effectiveness as a whole in performing its oversight responsibilities are described below.
Our ten current directors, who are also the nominees below, are comprised of one woman and nine men. Our director emeritus is also a woman. Of the ten directors, nine identify as White, and one male director identifies as African American or Black.
Kevin J. McNamara Director since 1987 Age: | Mr. McNamara’s experience, qualifications, attributes and skills include serving as President and Chief Executive Officer of the Company. He has held these positions since August 1994 and May 2001, respectively. Previously, he served as Executive Vice President, Secretary and General Counsel from November 1993, August 1986 and August 1986, respectively, to August 1994. |
Ron DeLyons Director since 2020 Age: 60 | Mr. DeLyons’ experience, qualifications, attributes and skills include serving as a Managing Member and Chief Executive Officer of Creekwood Energy Partners, LLC (renewable energy). He has held this position since 2004. Prior to that, Mr. DeLyons was the co-founder and Chief Executive Officer of Greystone Investment Management. In April 2021, Mr. DeLyons earned his certificate of completion for Berkeley Law’s Executive Education course on ESG matters, ESG: Navigating the Board’s role. |
7
Joel F. Gemunder Director since 1977 Age: | Mr. Gemunder’s experience, qualifications, attributes and skills include having served as President and Chief Executive Officer of Omnicare, Inc., Cincinnati, Ohio (healthcare products and services) (“Omnicare”). Omnicare, a former Fortune 500 Company acquired by CVS Health Corporation in 2015, is a leading provider of pharmaceutical and related services for seniors serving residents of skilled nursing, assisted living, and other healthcare facilities across the United States. He retired from these positions in August 2010, having served since May 1981 and May 2001, respectively. Omnicare is a former equity investee of the Company that became a |
Patrick P. Grace Director since 1996 Age: | Mr. Grace’s experience, qualifications, attributes and skills include serving in various executive positions at W.R. Grace & Co. from 1977 to 1995, most recently as President and CEO of Grace Logistics, Inc., an operating company with oversight responsibility for Grace’s $5.0 billion global supply chain. He is currently President and CEO of Grace Institute Foundation. From 1996 to 2017, he served as Chairman of the Grace Institute, New York, New York (workforce development for women). He was the co-founder and managing Principal of Apollo Philanthropy Partners, L.L.C., New York, New York (philanthropic advisory services) from 2008 to 2012. From 1996 to 2017 he served as President of MLP Capital, Inc., New York, New York, an investment holding company which managed several real estate and mining interests in the southeastern United States. From 2008 to 2017 he served as Chairman of KickStart International, a global poverty alleviation organization. He also |
Christopher J. Heaney Director since 2020 Age: 68 | Mr. Heaney’s experience, qualifications, attributes and skills include previously serving as Vice President of Operations, and then President and Chief Executive Officer of Service America Systems, Inc. (home and service warranties), a former wholly-owned subsidiary of the Company (“Service America”). The Company sold Service America to an investment group led by Mr. Heaney in 2005, and Mr. Heaney served as its President and Chief Executive Officer until 2009. Prior to his roles with Service America, Mr. Heaney served as a Senior Vice President and Group Senior Vice President with Veratex Group (dental supplies), while a wholly-owned subsidiary of first Omnicare and then the Company. |
Thomas C. Hutton Director since 1985 Age: | Mr. Hutton’s experience, qualifications, attributes and skills include serving as a Vice President of the Company. He has held this position since February 1988. Previously, Mr. Hutton, who has a J.D. and Master’s of Public Administration degree from Cornell University, practiced corporate law in New York concentrating in securities and regulatory law from 1977 to 1987. He served as a director of Omnicare from May 1983 to May 2001. Currently Mr. Hutton serves as a trustee on three private foundations including the Chemed Foundation. |
Andrea R. Lindell Director since May 2008 Age: | Ms. Lindell’s experience, qualifications, attributes and skills include having served as Dean and a Professor of the College of Nursing at the University of Cincinnati. She retired from these positions in January 2011 having held them since December 1990. She is currently Professor Emeritus at the college. Since January 2016 she has served as Dean, having held the title of Associate Dean from January 2013 to January 2016, previously holding the title of Interim Associate Dean from August 2011, at the School of Nursing, Walden University. She is also Vice-Provost of Walden’s College of Health Sciences. Walden offers online degrees as follows: BSN, MSN, DNP. Ms. Lindell was also Associate Senior Vice President of the Medical Center at the University of Cincinnati from July 1998 until January 2011. The College of Nursing’s programs include over 1,500 students, and offer the following degrees: BSN, MSN, Post MSN, and PhD. From September 1994 to June 2002, she also held an additional position as Founder and Interim Dean of the College of Allied Health Sciences at the University of Cincinnati. She was a director of Omnicare until May 2014. |
8
Thomas P. Rice Director since May 2009 Age: | Mr. Rice’s experience, qualifications, attributes and skills include having served as Chief Executive Officer of Andrx Corporation, Fort Lauderdale, Florida (specialty pharmaceuticals) (“Andrx”), from February 2004 to November 2006, when Andrx was sold to Watson Pharmaceuticals. Following the sale, Mr. Rice returned as General Manager and Majority Partner of Columbia Investments LLC, Baltimore, Maryland, which invests in local emerging businesses in Baltimore and which Mr. Rice co-founded in January 1996. He was also a Director of Par Pharmaceuticals, Woodcliff Lake, |
Donald E. Saunders Director from May 1981 to May 1982, May 1983 to May 1987 and since May 1998 Age: | Mr. Saunders’ experience, qualifications, attributes and skills include having served as a Professor at the Farmer School of Business, Miami University, Oxford, Ohio. He held this position from August 2001 until his retirement in January 2015. Miami University is a public university with a student population of 16,000. He earned a doctorate in Economics, with a minor in Accounting, from Indiana University. He has taken Masters level courses in financial reporting, financial valuation, and risk management. Mr. Saunders retired as President of DuBois (a former wholly-owned subsidiary of the Company), then a division of Diversey, in October 2000, having held that position since November 1993. |
George J. Walsh III Director since 1995 Age: | Mr. Walsh’s experience, qualifications, attributes and skills include serving as a partner with the law firm of Thompson Hine LLP, New York, New York. He has held this position since May 2002. Prior to this date, Mr. Walsh was a partner with the law firm of Gould & Wilkie LLP, New York, New York, and held this position since January 1979. Gould & Wilkie merged with Thompson Hine on May 1, 2002. Mr. Walsh was elected the Chairman of the Board of Directors in March 2009. |
The Board unanimously recommends that you vote FOR the election of each of the above-named nominees.
CORPORATE GOVERNANCE
Director Compensation
The Company’s compensation program for directors who are not employees of the Company consists of annual cash fees and fully vested stock awards granted pursuant to the Chemed Corporation 2010 Stock Incentive Plan (as amended, supplemented or otherwise modified as of the date hereof, the “2010 Incentive Plan”), the Chemed Corporation 2015 Stock Incentive Plan (as amended, supplemented or otherwise modified as of the date hereof, the “2015 Incentive Plan”) and the Chemed Corporation 2018 Stock Incentive Plan (as amended, supplemented or otherwise modified as of the date hereof, the “2018 Incentive Plan”). Directors who are not employees of the Company may also participate in the Chemed Corporation Deferred Compensation Plan for Non-Employee Directors (the “Director Deferred Compensation Plan”), which is described below. Directors who are employees of the Company do not receive cash compensation for their service as directors, and do not receive annual fully vested stock awards for such service.
service.
9
The Board reviews and sets the cash compensation and fully vested stock awards for non-employee directors based on recommendation of the Compensation/Incentive Committee (the “Compensation Committee”). In making its determination, the Board seeks input from the Compensation Committee’s independent compensation consultant, Compensation Strategies, Inc., as well as certain executive officers of the Company, and considers any such input, including as to the level of compensation necessary to attract and retain qualified directors, among the factors it reviews in setting the amount of compensation. Director compensation is reviewed annually. It was most recently reviewed byannually and from time to time the Board (withrequests and receives input from Compensation Strategies, Inc.) in May of 2018,, in light of current peer group constituency and market data.
Each member of the Board of Directors who is not an employee of the Company is paid an annual fee of $55,000.$65,000. Directors also receive a fee of $3,000 for each Board meeting attended. Non-employee directors also received annual fully vested stock awards in the amount of $85,000, increased from $60,000 on May 15, 2017.approximately $130,000. Mr. Walsh is paid an additional annual fee of $145,000 for his service as Chairman of the Board. Each member of the Board’s Audit Committee (other than its chairman), Compensation Committee (other than its chairman) and Nominating Committee (other than its chairman) is paid an additional annual fee of $10,000, $7,000 and $7,000, respectively, for his or her service on that Committee. The chair of the Audit Committee is paid $25,000 per year, the chair of the Compensation Committee is paid $15,000 per year effective May 15, 2017, increased from $7,500, and the chair of the Nominating Committee is paid $10,000, effective May 15, 2017, increased from $7,000 per year.$10,000. A Committee member also is paid $1,000 for each Committee meeting attended unless the Committee meeting is on the same day as a meeting of the Board of Directors, in which case Committee members are paid $500 for attendance at the Committee meeting. Messrs. McNamara and Hutton, who are employees of the Company, do not receive compensation for their service as directors. Each member of the Board of Directors and of a Committee is additionally reimbursed for continuing education expenses and reasonable travel expenses incurred in connection with attendance at Board and Committee meetings. No Compensation Committee member received any compensation from the Company other than as a director.
In May 2018,2021, Messrs. DeLyons, Gemunder, Grace, Krebs,Heaney, Rice, Saunders, Walsh and WoodWalsh and Ms. Lindell each received $85,106approximately $130,000 in the form of a fully vested stock award of 255270 shares of Capital Stock.
In addition, the Company maintains the Director Deferred Compensation Plan in which directors who are not employees of the Company or of a subsidiary of the Company participate. Under such plan, which is not a tax-qualified plan, an account is established for each participant to whom amounts are credited quarterly at the rate of $6,000 per year. These amounts are used to purchase shares of Capital Stock, and all dividends are reinvested in Capital Stock. Each participant is entitled to receive the balance in his or her account within 90 days following the date he or she ceases to serve as a director. In 2018,2021, each of Messrs. DeLyons, Gemunder, Grace, Krebs,Heaney, Rice, Saunders, Walsh and WoodWalsh and Ms. Lindell received contributions of $6,000, in each case in his or her respective account in the Director Deferred Compensation Plan.
Directors may participate in the Company’s health insurance plans by paying rates offered to former employees under COBRA, and may use available space, on a non-exclusive basis, in the Company’s New York office.
10
In 2018,2021, the Company provided the following compensation to directors and directors emeriti for their service to the Company:
DIRECTOR COMPENSATION - 20182021 (a)
Name | Fees Earned or Paid in Cash ($) | Stock Awards ($)(b) | All Other Compensation ($) | Total ($) | Fees Earned or Paid in Cash ($) | Stock Awards Total ($)(b) | All Other Compensation ($) | Total ($) | ||||
| Ron DeLyons | 95,500 | 136,318 | - | 231,818 | ||||||||
| Joel F. Gemunder | 81,000 | 91,106 | - | 172,106 | 88,000 | 136,318 | - | 224,318 | ||||
| Patrick P. Grace | 115,500 | 91,106 | - | 206,606 | 121,500 | 136,318 | - | 257,818 | ||||
| Walter L. Krebs | 82,000 | 91,106 | - | 173,106 | ||||||||
| Sandra E. Laney | 20,000 | 91,106 | - | 111,106 | ||||||||
| Christopher J.Heaney | 89,000 | 136,318 | - | 225,318 | ||||||||
| Sandra E. Laney (c) | 20,500 | 136,318 | - | 156,818 | ||||||||
| Andrea R. Lindell | 82,000 | 91,106 | - | 173,106 | 89,000 | 136,318 | - | 225,318 | ||||
| Thomas P. Rice | 89,500 | 91,106 | - | 180,606 | 95,500 | 136,318 | - | 231,818 | ||||
| Donald E. Saunders | 91,500 | 91,106 | - | 182,606 | 95,000 | 136,318 | - | 231,318 | ||||
| George J. Walsh III | 245,000 | 91,106 | - | 336,106 | 250,000 | 136,318 | - | 386,318 | ||||
| Frank E. Wood | 82,000 | 91,106 | - | 173,106 | ||||||||
| (a) | The Director Compensation Table excludes executive compensation figures for Messrs. McNamara and Hutton who are employees of the Company. | |
| (b) | Amounts for each of Messrs. | |
| (c) | Director Emeritus. |
Directors Emeriti
The Board of Directors has a policy of conferring the honorary designation of Director Emeritus upon former directors who made valuable contributions to the Company and whose continued advice is believed to be of value to the Board of Directors. The designation as Director Emeritus is customarily conferred by the Board on an annual basis but may be conferred at such other times and for such other periods as the Board may determine. Each Director Emeritus is furnished with a copy of all agendas and other materials furnished to members of the Board of Directors generally, and is invited to attend all meetings of the Board; however, a Director Emeritus is not entitled to vote on any matters presented to the Board. A Director Emeritus is paid an annual fee of $18,000 and $500 for each meeting attended.
Ms. Laney, who served as a director of the Company from 1986-2009, was initially designated a Director Emeritus in May 2009 and has been so designated in each subsequent May. In 2018,2021, the Company paid Ms. Laney $20,000$20,500 in cash fees, $6,000 in Capital Stock deposited to the Director Deferred Compensation Plan, and granted her $85,106approximately $130,000 in the form of a fully vested stock award of 255270 shares of Capital Stock in her capacity as a Director Emeritus.
Majority Voting in Director Elections
The Company’s bylaws require a majority voting standard for uncontested elections of directors. As described above under “Election of Directors,” each director must receive the affirmative vote of the majority of the votes cast to be elected in an uncontested election. Each incumbent director nominee has submitted an irrevocable letter of resignation as director that becomes effective if he or she does not receive the affirmative vote of the majority of the votes cast in an uncontested election and the Board of Directors accepts the resignation. In contested elections, each director must receive a plurality of the votes cast. An election is contested if (a) a stockholder has nominated any person(s) for election to the Board of Directors in compliance with our bylaws or otherwise in accordance with applicable law and (b) such nomination has not been withdrawn on or prior to the fourteenth day prior to the date the Company first mails its notice of meeting.
11
Committees and Meetings of the Board
The Company has the following Committees of the Board of Directors: Audit Committee, Compensation Committee and Nominating Committee.
Audit Committee The Audit Committee (a) is directly responsible for the appointment, compensation and oversight of a firm of independent registered accountants to audit the consolidated financial statements of the Company, (b) reviews and reports to the Board of Directors on the Company’s annual financial statements and the independent accountants’ report on such financial statements, (c) meets with the Company’s senior financial officers, internal auditors and independent accountants to review audit plans and work regarding the Company’s accounting, financial reporting and internal control systems and other non-audit services, and (d) confers quarterly with senior management, internal audit staff and the independent accountants to review quarterly financial results. Each member of the Audit Committee is independent as defined under the listing standards of the New York Stock Exchange. The Committee conducts an annual self-evaluation that is shared with the Board. A copy of the Audit Committee Charter is available on the Company’s Web site, www.chemed.com.website at ir.chemed.com/corporate-governance/highlights.
Compensation Committee The executive compensation program is administered by the Compensation Committee. The Compensation Committee makes recommendations to the Board of Directors concerning (a) base salary and annual cash incentive compensation for executives of the Company, (b) establishment of incentive compensation plans and programs generally, (c) adoption and administration of certain employee benefit plans and programs, (d) additional year-end contributions by the Company under the Chemed/Roto-Rooter Savings & Retirement Plan (as amended, supplemented or otherwise modified as of the date hereof, the “Retirement Plan”), and (e) non-employee director compensation. In addition, the Compensation Committee administers the 2010 Incentive Plan, the 2015 Incentive Plan, and the 2018 Stock Incentive Plan (the “Stock Incentive Plans”), under which it reviews and approves the granting of cash,stock, stock options and performance share units. The Compensation Committee determines annually whether to retain or terminate any compensation advisor, after considering specific independence factors. It is directly responsible for the appointment, compensation and oversight of such advisor. Each member of the Compensation Committee is independent as defined under the listing standards of the New York Stock Exchange. The Committee conducts an annual self-evaluation that is shared with the Board. A copy of the Compensation Committee Charter, as revised in 2018, is available on the Company’s Web site, www.chemed.com.website at ir.chemed.com/corporate-governance/highlights.
Nominating Committee The Nominating Committee (a) recommends to the Board of Directors the candidates for election to the Board at each Annual Meeting of Stockholders of the Company, (b) recommends to the Board of Directors candidates for election by the Board to fill vacancies on the Board, (c) considers candidates submitted to the Nominating Committee by directors, officers, employees, stockholders and others, and (d) performs such other functions as may be assigned by the Board. Board, including the review of political expenditures. The Nominating Committee Chair leads the annual Board evaluation and the self-evaluation of the Nominating Committee, which is shared with the Board.
Procedures Regarding Director Candidates In identifying and evaluating nominees for director, the Nominating Committee considers candidates with a wide variety of academic backgrounds and professional and business experiences. After reviewing the candidates’ backgrounds and qualifications, the Nominating Committee personally interviews those candidates it believes merit further consideration. Once it has completed this process, the Nominating Committee makes its final recommendations to the Board. Stockholders wishing to submit a candidate for election to the Board should submit the candidate’s name and a supporting statement to the Company’s Secretary at Suite 2600, 255 East Fifth Street, Cincinnati, Ohio 45202-4726. The Nominating Committee has no formal policy with regard to the consideration of director candidates recommended by stockholders because it believes such recommendations are sufficiently rare that they may be effectively considered on a case-by-case basis. The Nominating Committee considers diversity in identifying nominees.nominees specifically including race, ethnicity and gender diversity. It assesses the effectiveness of the Company’s diversity policy every year as part of the nomination process for the annual election of directors by the Company stockholders. The Committee is committed to including, in the initial list of candidates from which new director nominees are chosen by the Board, candidates with a diversity of race, ethnicity and gender. Having reviewed the collective background and experience of all nominees, the Board has concluded they provide significant diversity. Its policy is to select the most appropriate candidates for election. Board membership should reflect diversity in its broadest sense, including geography, gender, race, experience, professions, skills and backgrounds. The Nominating Committee does not assign specific weights to particular criteria. The background and qualifications of all directors, considered as a group, should provide a significant composite mix of experience, knowledge and abilities that allow the Board to fulfill its responsibilities. Each member of the Nominating Committee is independent as defined under the listing standards of the New York Stock Exchange. A copy of the Nominating Committee Charter is available on the Company’s Web site, www.chemed.com.
website at ir.chemed.com/corporate-governance/highlights.
12
Our ten current directors are comprised of one woman and nine men. Our director emeritus is also a woman. Of the ten directors, nine identify as White, and one male director identifies as African American or Black.
The following table shows the current membership of each committee and the number of meetings held by each committee during 2018:2021:
Director | Audit Committee | Compensation Committee | Nominating Committee |
J. F. Gemunder P. P. Grace* W. L. Krebs A. R. Lindell T. P. Rice* D. E. Saunders* G. J. Walsh III F. E. Wood | Chair x x | x x Chair x | x Chair x |
| Number of Meetings | 7 | 4 | 1 |
Director | Audit Committee | Compensation Committee | Nominating Committee |
R. DeLyons J. F. Gemunder P. P. Grace* C. J. Heaney A. R. Lindell T. P. Rice* D. E. Saunders* G. J. Walsh III | x Chair x x | x x Chair | x Chair x |
| Number of Meetings | 7 | 3 | 1 |
*Audit Committee Financial Expert as defined by Securities and Exchange Commission regulations.
Board Meetings The Board of Directors has five scheduled meetings a year, at which it reviews and discusses reports by management on the performance of the Company and its operating subsidiaries, its plans and properties, as well as immediate issues facing the Company. The Board also meets during its meetings in executive session, without executives or management directors present. Such sessions are presided over by the Chairman of the Board.
During 2018,2021, there were five meetings of the Board of Directors and two meetings of the Executive Committee. Each directorall directors attended at leastgreater than 80% of the Boardsuch meetings and his or her applicable Committee meetings. While the Company does not have a formal policy with regard to Board members’ attendance at the Annual Meeting of Stockholders, all members of the Board are encouraged to attend. All members of the Board attended last year’s Annual Meeting of Stockholders held virtually on May 21, 2018.17, 2021.
Director Independence The Board and the Nominating Committee undertake an annual review of director and nominee independence. They consider transactions and relationships between each director or nominee or any member of such director’s or nominee’s immediate family or any other person sharing such director’s or nominee’s home and the Company and its subsidiaries and affiliates, including those reported under the heading “Transactions With Related Persons” below. The Board and the Nominating Committee also examine transactions and relationships between directors and nominees and their respective affiliates and members of the Company’s senior management and their affiliates. The purpose of this review is to determine whether any such relationships or transactions are inconsistent with a determination that the director or nominee is independent under the New York Stock Exchange corporate governance listing standards.
13
As a result of its most recent review, the Board and the Nominating Committee affirmatively determined that, under the New York Stock Exchange listing standards, the following directors and nominees, constituting a majority of the individuals nominated for election as directors at the Annual Meeting, are independent of the Company and its management: Messrs. DeLyons, Gemunder, Grace, Krebs,Heaney, Rice, Saunders, Walsh and WoodWalsh and Ms. Lindell.
Risk Oversight The Board receives periodic reports from management on matters involving risk exposures such as regulatory changes, material litigation, cybersecurity, and recommended policy revisions.
Management maintains a formal Enterprise Risk Management (“ERM”) program that monitors management’s actions in response to the key risks facing the Company. The Audit Committee reviews various aspects of the ERM program periodically throughout the year. It oversees our risk identification and mitigation process. It reviews material financial risk exposures including regulatory and compliance matters, acquisitions, cybersecurity, economic conditions and interest rate exposures. Members of our management, including our Chief Financial Officer, Chief Legal Officer, Vitas Compliance Officer, and our Director of Internal Audit, report to the Audit Committee regarding on-going risk management process activities. The Audit Committee also reviews legal matters that may have a material impact on the Company’s financial statements. These Audit Committee reviews are conducted on at least an annual basis, or more frequently if a significant risk exposure matter develops.
While the Board has responsibility for the Company’s risk oversight, management is responsible for day-to-day risk management processes. We believe this division of responsibilities most effectively addresses the risks we face and that our Board leadership structure supports this approach.
Compensation Risk Management has reviewed the compensation policies and practices for our employees and has concluded that they do not create risks that are reasonably likely to have a material adverse effect on us.the Company.
The Compensation Committee oversees our risks related to compensation programs and philosophy. It ensures our compensation programs do not encourage excessive risk taking. Determining incentive awards based on a variety of performance metrics diversifies the risk associated with any one performance indicator. The mix of fixed and variable, annual and long-term, and cash and equity compensation is also designed to encourage actions in the Company’s long-term best interests. The Committee works periodically with our independent compensation consultant to ensure our executive compensation plans are appropriately balanced and incentivize management to act in the best interests of our stockholders.
As described in more detail below under “Compensation Discussion and Analysis”, long-term compensation programs for our named executive officers have been structured such that long-term compensation is linked to our long-term relative and absolute performance. This model of linking long-term compensation to our performance applies not only to our named executive officers, but has also been applied to other senior corporate personnel. We believe that our compensation plans reflect sound risk management practices and do not encourage excessive or inappropriate risk taking.
Compensation Committee Interlocks and Insider Participation The Compensation Committee is currently comprised of Messrs. Walsh Krebs and WoodHeaney and Ms. Lindell. No member of the Compensation Committee has any direct or indirect material interest in or relationship with the Company, other than holdings of Capital Stock as set forth under the heading “Security Ownership of Certain Beneficial Owners and Management” below and as related to his or her position as a director. During 2018,2021, no executive officer of the Company served on the compensation committee of any other entity where an executive officer of such entity also served on the Board of Directors, and no executive officer of the Company served on the board of directors of any other entity where an executive officer of such entity also served on the Compensation Committee.
Board Leadership Structure The Board has separated the functions of Chief Executive Officer and Chairman of the Board. Mr. Walsh currently serves as Chairman. The Board believes this separation of function promotes independence and enhances corporate governance.
14
Related Person Policies and Procedures The Audit Committee reviews all material transactions with related persons as identified by management. In February 2007, the Audit Committee adopted a written policy and set of procedures for reviewing transactions between the Company and related persons, who include directors, nominees, executive officers and any person known to be the beneficial owner of more than 5% of the Company’s voting securities (each, a “related person”), any immediate family member of a related person and any person sharing the household of a related person. The policy also covers any firm, corporation or other entity in which any related person is employed or is a partner or principal, or in which such related person has a 5% or greater beneficial ownership interest. Prior to entering into a transaction with a related person, notice must be given to the Secretary of the Company containing (a) the related person’s relationship to the Company and interest in the transaction, (b) the material facts of the transaction, (c) the benefits to the Company of the transaction, (d) the availability of any other sources of comparable products or services, and (e) an assessment of whether the transaction is on terms comparable to those available to an unrelated third party. If the Company’s Secretary and Chief Financial Officer determine that it is a related party transaction exceeding $100,000, the proposed transaction is submitted to the Audit Committee for its approval. The policy also provides for the quarterly review of related person transactions which have not previously been approved or ratified and any other such transactions which come to the attention of the Company’s Chief Executive Officer, Chief Financial Officer, Controller or Secretary. If the transaction is pending or ongoing, it will be promptly submitted to the Audit Committee for approval. If the transaction is completed, it will be submitted to the Audit Committee to determine if ratification or rescission is appropriate. This policy also covers charitable contributions or pledges by the Company to non-profit organizations identified with a related person.
Code of Ethics The Board of Directors has adopted Corporate Governance Principles and Policies on Business Ethics, which, along with the charters of the Audit, Compensation and Nominating Committees, are available on the Company’s Web sitewebsite under Corporate Governance — Governance Documents (www.chemed.com). Printed copies may be obtained from the Company’s Secretary at Suite 2600, 255 East Fifth Street, Cincinnati, Ohio 45202-4726.
Other Corporate Policies and Reports The Company also maintains certain other corporate policies and reports on its website under Corporate Governance – Governance Documents, including its Environmental Policy, its Human Rights Policy, its Policies on Political Spending, and its Semiannual Political Spending Report, which was published in response to the successful stockholder proposal at the 2021 Annual Meeting.
Stockholder Communications Stockholders and others wishing to communicate with members of the Board should mail such communications to the Company’s Secretary at Suite 2600, 255 East Fifth Street, Cincinnati, Ohio 45202-4726. The Secretary will forward these communications to the Board and, if applicable, to specified individual directors.
EXECUTIVE COMPENSATION
Compensation Discussion and Analysis
This Compensation Discussion and Analysis explains the material elements of the compensation of the Company’s named executive officers. The Company’s named executive officers for 20182021 are Kevin J. McNamara, President and Chief Executive Officer; David P. Williams, Executive Vice President and Chief Financial Officer; Nicholas M. Westfall, Executive Vice President; Spencer S. Lee, Executive Vice President; and Naomi C. Dallob,Michael D. Witzeman, Vice President Secretary and Chief Legal Officer.Controller.
Consideration of the 20182021 Say On Pay Vote
Following our 20182021 Annual Meeting of Stockholders, the Compensation Committee and the Board of Directors reviewed the results of the non-binding stockholder advisory vote on our executive compensation (“20182021 Say On Pay Vote”). Stockholders voted in favor of Say On Pay, with 95.50%95.02% positive votes, 4.09%4.78% negative votes and .40%0.19% abstentions (percentages rounded to nearest hundredth of a percent). Based on the strong favorable vote and with input solicited from Company stockholders, the Compensation Committee and Board maintained its executive compensation policies and practices that include the following changes from earlier practices (abbreviated terms are defined below):
15
| ● | Replacement of the previous annual incentive program, which was based on a multiple of historical growth rates in Adjusted EPS applied to prior year actual payouts, with a target bonus plan based on achieving goals related to Adjusted EPS and Return on Assets; |
| ● | Replacement of the previous long-term incentive plan with performance share units subject to performance-based vesting related to a cumulative three-year Adjusted EPS target and a three-year relative TSR performance |
| ● | A policy that |
| ● | A clawback policy such that the Compensation Committee will review all performance-based compensation awarded to, or earned by, certain officers during the three-year period prior to any restatement of the Company’s financial results. If the Compensation Committee determines such compensation would have been lower had it been calculated based on the restated financial statement, the Compensation Committee may seek to recover the excess amount. |
| ● | Additionally, in 2018, the Board of Directors amended The Senior Executive Severance Policy and the Change in Control Plan to limit any gross-up payments payable under the plans to the then-existing participants in the plans. |
Overview of Compensation Program
The executive compensation program is administered by the Compensation Committee. The membership of the Compensation Committee is comprised of fourthree independent directors. The Compensation Committee is responsible for the review, approval and recommendation to the Board of Directors of matters concerning (a) base salary and annual cash incentive compensation for executives of the Company, (b) establishment of incentive compensation plans and programs generally, (c) adoption and administration of certain employee benefit plans and programs, and (d) additional year-end contributions by the Company under the Retirement Plan. The recommendations of the Compensation Committee on such matters must be approved by the non-employee members of the Board of Directors. The employee members of the Board of Directors are not present when compensation recommendations are presented to the Board of Directors and discussed, and such members do not vote on compensation issues. The Compensation Committee also administers the Stock Incentive Plans. Under authority granted it by those plans, it reviews and approves the granting of stock options and performance share units. The Compensation Committee also annually determines whether to retain or terminate the services of independent compensation consultants to assist and advise it in administering the executive compensation program after considering certain independence factors. Currently, Compensation Strategies, Inc., an independent compensation advisory firm, has been retained by, and reports directly and exclusively to, the Compensation Committee. The scope of these consulting services is limited to (a) advising the Compensation Committee regarding executive compensation, (b) performing studies of general market and peer group compensation levels, and (c) advising the Board on director compensation, all upon request of the Compensation Committee. Compensation Strategies, Inc. does no other work for the Company outside of providing these compensation advisory services.
16
How Compensation Decisions Are Made
Generally, in February of each year, certain senior executives of the Company, including the Chief Executive Officer, prepare recommendations for annual cash incentives to be made to Company employees, based on the performance of the Company and its subsidiaries during the past year. For the past five years, theThe Compensation Committee traditionally granted stock option awards in November, to more fully reflect the Company’s financial and stock price performances during that year. Beginning in 2019, the Compensation Committee will grantbegan granting stock option awards on the day of the release of the Company’s third quarter earnings results. The recommendations made by the Chief Executive Officer and other senior executives to the Compensation Committee, which include detailed memoranda, and tally sheets, take into consideration historical compensation, including base salaries, annual incentive compensation and long-term equity awards, performance of the Company as a whole, both on an absolute basis and relative to its peer group, and performance of the individual business unit for which the employee is responsible.responsible, if applicable. The Compensation Committee then meets to determine the long-term equity awards for each executive and to review and consider the recommendations prepared by the Company’s senior executives in order to determine the recommendations that the Compensation Committee will make to the non-employee members of the Board of Directors with respect to the amount of incentives for each executive. In finalizing their grants of stock option awards, the Compensation Committee considers the recommendation of the senior executives and the factors presented by them listed above, the compensation of the Company’s senior executives compared to its peer group and other industry data, the overall mix of compensation for senior executives (as a whole and individually), and the performance of the Company and its business units for the current year. Because stock options are granted after a considerable amount of the year has elapsed and after base salary and performance share units have been granted, option grants may increase or decrease materially in order to help reflect management’s or any member of management’s performance during the year, in the context of the entire executive compensation program. Additionally, the Black-Scholes valuation model used to value stock options granted is highly dependent on the Company’s stock price. Significant variation in the stock price can lead to significant changes in the ascribed value of the grant date fair value of option awards. The Compensation Committee makes compensation recommendations to the non-employee members of the Board of Directors regarding the compensation of the Chief Executive Officer without the input of any Company employees. The Compensation Committee can modify any recommendations of the Company’s senior executives.
Base salaries of executives are periodically reviewed by the Compensation Committee and approved by the non-employee members of the Board of Directors. As a component of the review and approval process, the Compensation Committee and the non-employee members of the Board consider the recommendations of the Chief Executive Officer and certain senior executives of the Company as to the base salaries of Company executives, other than the Chief Executive Officer. The Chief Executive Officer’s base salary is reviewed and determined without the input of Company employees. In determining recommended base salaries for the Company’s executives, as more fully discussed under “Base Salaries” below, the Compensation Committee also considers each executive’s then-current base salary and their individual performance.
The Compensation Committee directly grants compensation under the Stock Incentive Plans.
Role of Executive Officers
The Chief Executive Officer and certain other senior executives of the Company provide recommendations to the Compensation Committee concerning compensation of Company executives, other than the Chief Executive Officer. Additionally, as part of its process, the Compensation Committee meets with the Chief Executive Officer to obtain input with respect to compensation decisions, including the performance of the Company’s senior executives other than the Chief Executive Officer. In addition to meeting with the Chief Executive Officer, the Compensation Committee meets in executive session without any Company employees present.
Objectives of Compensation Program
The Company’s executive compensation program is intended to achieve the objectives of aligning executives’ interests with those of its stockholders by (i) rewarding the executives for long-term growth in the value of the Capital Stock and encouraging them to hold a significant amount of the Company’s equity; (ii) paying for performance through both cash and equity-based incentives that, in turn, provide greater rewards for stronger performance of the Company as a whole and the Company’s business units; (iii) paying competitively in order to attract and retain senior executives; and (iv) creating incentive to maximize the long-term growth of the Company’s business. To achieve these objectives, the elements of executive compensation are designed to reward past performance and establish incentive for future growth.
17
Elements of Compensation
The elements of the Company’s executive compensation program are: base salary, annual cash incentive compensation and long-term incentive compensation in the forms of stock option awards, restricted share awards, performance share units, and certain perquisites. Components of compensation that are available generally to all Company employees, including the Company’s named executive officers, are defined contribution plans and welfare benefit plans (including life insurance, health insurance, dental insurance and long-term disability benefits). In addition, the Chemed Corporation Excess Benefit Plan (as amended, supplemented or otherwise modified as of the date hereof, the “Excess Benefit Plan”), the Chemed Corporation Long Term Care Insurance Plan, the Chemed Corporation Supplemental Pension and Life Insurance Plan (as amended, supplemented or otherwise modified as of the date hereof, the “Supplemental Pension Plan”), and the Roto-Rooter Deferred Compensation Plan (as amended, supplemented or otherwise modified as of the date hereof, the “Deferred Compensation Plan”) are available as components of compensation to executives and other highly compensated individuals. Base salary, annual cash incentive compensation and pension and welfare benefit plans are established by the non-employee members of the Board based on the levels that the Compensation Committee and such Board members determine are competitive and are intended to reward executives for current and past performance, while longer-term incentives, such as stock option awards and performance share unit awards are intended to create incentive for future growth. The Company’s executive compensation program also offers perquisites commonly available to senior executives.
Executive Compensation Consultant
The Compensation Committee’s charter grants it sole authority regarding the appointment, compensation and oversight of the Company’s executive compensation consultant. The Compensation Committee retained Compensation Strategies, Inc., after considering specific independence factors, as its consultant to assist the Compensation Committee with its responsibilities related to the Company’s compensation program for its executives and Board of Directors. During 2013, Compensation Strategies, Inc. advised the Compensation Committee and assisted in the development of the Company’s revised management compensation program. The consultant was instrumental in (i) establishing a new peer group against which to benchmark executive compensation, (ii) developing annual incentive compensation target goals and target bonus percentages by executive, (iii) setting Adjusted EPS and Return on Assets payout percentages by performance level, (iv) establishing three-year goals for Adjusted EPS CAGR and relative TSR performance share units, and (v) implementing the Company’s clawback provision and “double trigger” regarding incentives in the event of a change in control of the Company. On a periodic basis, the Company’s executive compensation consultant provides the Compensation Committee with a review of executive compensation. The most recent review, in 2019, included base salary, annual bonus, and long-term incentives for 1612 individuals and the Chief Executive Officer.
The Compensation Committee assessed the independence factors set forth in applicable SEC rules and other facts and circumstances in February 20192022 and concluded that the services performed by Compensation Strategies, Inc. did not raise any conflicts of interest.
Peer Group
In conjunction with its review of the management compensation program, and in consultation with Compensation Strategies, Inc., the Compensation Committee reviewed the peer group used to benchmark executive compensation. TheBased on changes to our previous Peer Group is as follows:
|
| |
|
| |
|
| |
|
| |
|
| |
|
| |
|
| |
|
| |
|
| |
|
ABM Industries, Inc. | National HealthCare Corp. |
Acadia Healthcare Co., Inc. | RadNet, Inc. |
Amedisys, Inc. | Rollins, Inc. |
Brookdale Senior Living, Inc. | Select Medical Holdings Corp. |
Clean Harbors, Inc. | Terminix Global Holdings, Inc. (previously |
Comfort Systems USA, Inc. | Service Master) |
Encompass Health Corp. | Stericycle, Inc. |
Hanger, Inc. | Team, Inc. |
Healthcare Services Group, Inc. | Tetra Tech, Inc. |
LHC Group, Inc. | The Ensign Group, Inc. |
MEDNAX, INC. | Tivity Health, Inc. |
The Compensation Committee began trackingwill track the Company’s relative TSR performance against the new Peer Group asgoing forward including for performance share units granted in 2022. With respect to performance stock units that were granted prior to 2020, the determination of the end of 2013. The Company’s Capital Stock hit record levels in 2018, rising from a low of $243.68 per share to a high of $335.99. It was priced at $283.29 a share at year end.relative TSR performance will be made against our previous Peer Group.
18
Amount of Each Element of Compensation; Decisions Concerning Payments
The Compensation Committee intends compensation to be linked directly to personal performance and to the Company’s overall results, as well as to the results of the specific business units for which executives are responsible. The Company’s executive compensation program is focused on rewarding superior operating performance and long-term growth.
The Compensation Committee meets as often as necessary in order to carry out its duties. In 2018,2021, the Compensation Committee met fourthree times. The Compensation Committee periodically reviews each executive’s total compensation, including base salary, annual cash incentive compensation, stock option awards, restricted stock awards and stock performance unit awards, and perquisites and defined contribution plan holdings (including the amounts contributed to such plans by the Company), as well as such executive’s Capital Stock holdings, in recommending or setting, as applicable, each element of compensation. The Compensation Committee balances the types of compensation for each executive between fixed compensation and performance-based compensation in such a way that less robust Company performance will result in a lower total compensation to the executive. Additionally, because the Compensation Committee grants stock options later in the year than its decision on other compensation, it can take into account the overall mix of compensation for each senior executive based on the Company’s results for the current year, and issue options to appropriately balance the senior executives’ compensation. Accordingly, grants of stock options often may vary more significantly from year to year, at times materially. For 2018,2021, about 72.975.1 percent of Mr. McNamara’s total compensation was performance-based, while the weighted average for the other named executive officers was about 70.273.4 percent. “Performance-based” compensation includes non equity incentive awards, option awards and performance share units.
Base Salaries
In determining the base salaries it recommends to the non-employee members of the Board, the Compensation Committee considers recommendations by certain senior executives of the Company, except with respect to the Chief Executive Officer, for whom the Compensation Committee makes its determination without the input of Company employees. In so doing, it considers each executive’s then-current base salary and evaluates the responsibilities held by each executive, current economic conditions, and his or her experience and performance. Additionally, Compensation Strategies, Inc. reviews base salaries and provides advice to the Compensation Committee. Positions are compared on the basis of job content and responsibility level to similar positions. The Compensation Committee recommends base salaries at levels it believes will attract and retain qualified executives. It believes that the base salaries as finally determined for each of the named executive officers were appropriate and competitive with salaries paid for similar positions by companies in the Peer Group referred to above and the Company’s industries. Effective May 1, 2018,2021, the Compensation Committee recommended base salary increases to Mr. McNamara, Mr. Williams, Mr. LeeWitzeman, and Ms. DallobMr. Lee in respective percentages of 6%5.0%, 6%5.0%, 8%5.0% and 6%6.0%, respectively. The Compensation Committee recommended Mr. Westfall receive a base salary increase of 6%5.0% effective June 1, 2018.2021.
Annual Non Equity Incentive Compensation
Amounts of annual non equity incentive compensation are recommended by the Compensation Committee to the non-employee members of the Board. The Company’s operating results as compared with historical results were previously the primary considerations in determining annual incentive compensation. For the past fiveeight years, in response to stockholder input and feedback from institutional proxy advisory firms, the Compensation Committee adopted a target bonus program based on achieving goals related to Adjusted EPS and Return on Assets.
The Company provides its named executive officers, other officers, and other key management employees an opportunity to earn an annual incentive award based on the Company’s, and its operating divisions’, financial performance each year. Adjusted EPS targets and Return on Assets targets are used to determine incentive compensation for senior executives of the Company, including the Chief Executive Officer. The Compensation Committee believes Adjusted EPS and Return on Assets are the most appropriate measurements of financial performance on an annual basis. They are among the most well-known measures of overall financial performance, widely used by both financial analysts and the investing public. The Compensation Committee believes using these measurements best aligns the interests of non equity incentive plan participants with those of the Company’s stockholders. In March 2018, the Committee evaluated and revised the non equity compensation incentive target percentages to better align compensation with performance.
19
The detailed calculation of annual incentive compensation based on 20182021 performance versus targets for the named executive officers is shown in the following narrative and tables.
The following table shows each named executive officer’s target non equity incentive compensation percentage as a percentage of base salary.
Target Non Equity Incentive Compensation Percentages of Base Salary | |||
K. J. McNamara | 125% | ||
D. P. Williams | 105 | ||
| N. M. Westfall | 105 | ||
| S. S. Lee | 105 | ||
M. D. Witzeman | |||
| 75 | |||
The Adjusted EPS target is weighted 75% of total non equity incentive compensation opportunity, and the Return On Assets target weighted 25% of total non equity incentive compensation opportunity. Performance above target(s) results in incentive compensation greater than the target percentage of salary; performance below target(s) results in non equity incentive compensation lower than the target percentage of base salary. The target multipliers are highly leveraged both above and below target performance. The maximum multiplier of 200% is achieved at Adjusted EPS at 14% over target and the minimum multiplier of 0% is effective at Adjusted EPS 20% below target; for Return On Assets, the maximum multiplier of 200% is achieved at Return On Assets of 140% of target and the minimum multiplier of 0% is effective at Return On Assets of 60% of target.
(The remainder of this page intentionally left blank)
20
The following table shows target and actual performance for the Company and its subsidiaries, the percent of target achievement, and the target multiplier.
OPERATING RESULTS COMPARISONS VS. TARGETS FOR 20182021
| 2021 Actual/Target | ||||||||||||||||||
| 2018 Actual/Target | Adjusted | Return on | ||||||||||||||||
Adjusted E.P.S. | Return on Total Assets | E.P.S. | Total Assets | |||||||||||||||
| (75%) | (25%) | (75 | %) | (25 | %) | |||||||||||||
| VITAS | ||||||||||||||||||
| (1) | Actual | $ | 8.55 | 26.2 | % | |||||||||||||
| Target | 7.61 | 24.0 | % | Actual | $ | 11.58 | 26.5 | % | ||||||||||
| Percent of Target | 112.4 | % | 109.2 | % | Target | 10.95 | 26.1 | % | ||||||||||
| Target Multiplier | 189.7 | % | 122.9 | % | Percent of Target | 105.8 | % | 101.5 | % | |||||||||
(4) | Target Multiplier | 143.2 | % | 103.8 | % | |||||||||||||
| Roto-Rooter | Roto-Rooter | Roto-Rooter | ||||||||||||||||
| (5) | Actual | $ | 6.05 | 33.7 | % | |||||||||||||
| Target | 4.96 | 28.9 | % | Actual | $ | 11.61 | 35.2 | % | ||||||||||
| Percent of Target | 122.0 | % | 116.6 | % | Target | 8.67 | 28.9 | % | ||||||||||
| Target Multiplier | 200.0 | % | 141.5 | % | Percent of Target | 133.9 | % | 121.8 | % | |||||||||
(8) | Target Multiplier | 200.0 | % | 154.5 | % | |||||||||||||
| Chemed Consolidated | Chemed Consolidated | Chemed Consolidated | ||||||||||||||||
| (9) | Actual | $ | 12.13 | 21.6 | % | Actual | $ | 20.25 | 22.3 | % | ||||||||
| (10) | Target | 10.61 | 18.7 | % | Target | 17.24 | 18.6 | % | ||||||||||
| (11) | Percent of Target | 114.3 | % | 115.5 | % | Percent of Target | 117.5 | % | 119.9 | % | ||||||||
| (12) | Target Multiplier | 200.0 | % | 138.8 | % | Target Multiplier | 200.0 | % | 149.7 | % | ||||||||
| 2021 TARGET/ACTUAL NON EQUITY INCENTIVE COMPENSATION EARNED | ||||||||||||
| NEO | 2021 Target Non Equity Incentive | 2021 Actual Non Equity Incentive Earned | Actual as a % of Target | |||||||||
K. J. McNamara | $ | 1,757,500 | $ | 3,293,994 | 187.4 | % | ||||||
D. P. Williams | 819,000 | 1,535,011 | 187.4 | |||||||||
N. M. Westfall | 603,750 | 805,101 | 133.4 | |||||||||
S. S. Lee | 552,038 | 1,041,281 | 188.6 | |||||||||
M. D. Witzeman | 262,875 | 492,693 | 187.4 | |||||||||
| NEO | 2018 Target Non Equity Incentive | 2018 Actual Non Equity Incentive Earned | Actual as a % of Target | |||||||||
| K. J. McNamara | $ | 1,465,000 | $ | 2,705,855 | 184.7 | % | ||||||
| D. P. Williams | 682,500 | 1,260,578 | 184.7 | |||||||||
| N. M. Westfall | 517,545 | 895,353 | 173.0 | |||||||||
| S. S. Lee | 462,630 | 857,600 | 185.4 | |||||||||
| N. C. Dallob | 306,000 | 565,182 | 184.7 | |||||||||
The following chart reconciles the EPS used in the non equity incentive compensation (NEIC) computation with the Adjusted EPS:
| As Reported in | As Used for | |||||||
| Charts on | NEIC | |||||||
| Pages 2 and 3 | Calculation | |||||||
Net Income as Reported (000) | $ | 205,543 | $ | 205,543 | ||||
Adjustments as Outlined on Page 3 | $ | (5,170 | ) | $ | (5,170 | ) | ||
Adusted Net Income as Outlined on Page 3 | $ | 200,373 | $ | 200,373 | ||||
Additional Adjustments for Non Equity Incentive Compensation | ||||||||
| Out of Pocket Acquisition Costs | $ | (559 | ) | |||||
| Medicare Cap Charge - Fourth Quarter 2017 | $ | (1,321 | ) | |||||
| Medicare Cap Charge - Fourth Quarter 2018 | $ | 2,217 | ||||||
Adjusted Net Income to be used for NEIC Calculations | $ | 200,710 | ||||||
Average Shares Outstanding Diluted (000) | 16,803 | |||||||
Actual Shares Outstanding for NEIC Calculation (actual as of 12/31/18) | 16,550 | |||||||
Adjusted Net Income Per Share | $ | 11.93 | $ | 12.13 | ||||
As Reported in Charts on Pages 2 and 3 | As Used for NEIC Calculation | |||||||
Net Income as Reported (000) | $ | 268,550 | $ | 268,550 | ||||
Adjustments as Outlined on Page 3 | $ | 39,457 | $ | 39,457 | ||||
Adjusted Net Income as Outlined on Page 3 | $ | 308,007 | $ | 308,007 | ||||
Additional Adjustments for Non Equity Incentive Compensation | ||||||||
| Medicare Cap Charge - Fourth Quarter 2020 | $ | (1,890 | ) | |||||
| Medicare Cap Charge - Fourth Quarter 2021 | $ | 2,269 | ||||||
| Adjusted Net Income to be used for NEIC Calculations | $ | 308,386 | ||||||
Average Shares Outstanding Diluted (000) | 15,938 | |||||||
Actual Shares Outstanding for NEIC Calculation (actual as of 12/31/21) | 15,226 | |||||||
Adjusted Net Income Per Share | $ | 19.33 | $ | 20.25 | ||||
22
Long-Term Incentives
The Compensation Committee grants long-term incentive compensation pursuant to the Stock Incentive Plans. While long-term incentive compensation may be paid under the Stock Incentive Plans in the form of stock option awards, performance share units, and restricted or fully vested stock awards, currently all of the long-term incentive awards granted pursuant to such plans (other than to outside directors) are in the form of stock options or performance share units, or restricted stock awards.units. In granting long-term incentives in the form of stock option awards and performance share units, and restricted stock awards, the Compensation Committee considers as recipients employees who have demonstrated capacity for contributing to the Company’s goals. The time-based restricted stock awards granted in May 2015 were transitional in nature as performance share units are now intended to replace them. No new grants of time-based restricted stock awards have been granted since May 2015, nor are any contemplated. In all cases, the long-term equity awards are intended to encourage employees to act as owners of the business, further aligning their interests with those of stockholders.
The Compensation Committee grants stock option awards with an exercise price at no less than 100% of fair market value of Capital Stock on the date granted. Since 2006, stockStock option awards vest ratably over three years, thus providing value to the Company’s employees only if the share price increases after the date such awards were granted and the employees remain employed for a significant period of time. Options awarded in November of 2016, 2017 and 20182015 or later carry a term of five years; those granted previously had a ten-year term.
Performance share units vest based on targeted criteria, including a three-year Adjusted EPS target and a three-year relative Total Shareholder Return (“TSR”) performance metric. In February 2018,2021, the Compensation Committee granted performance-based share units under the 20152018 Plan. Upon vesting, each unit is converted to one share of Capital Stock. Depending on the Company’s performance as measured by the three-year growth rate in Adjusted EPS and three-year TSR as compared with the Peer Group, the shares earned will vary between 0% and 200% of the target grants.
The following two tables detail the percentages of the target grants that will be earned depending on the actual Adjusted EPS and TSR performance levels for the period beginning January 1, 20182021 and ending December 31, 2020.2023.
3-Year Adjusted EPS CAGR | Percentage of Target Shares | 3-Year Adjusted EPS CAGR | Percentage of Target Shares | ||
| Maximum | 11% | 200.0% | 11% | 200.0% | |
| Target | 7% | 100.0% | 7% | 100.0% | |
| Minimum | 3% | 0.0% | 3% | 0.0% | |
3-Year TSR Percentile | Percentage of Target Shares | ||||
| Maximum | Greater than 90th | 200.0% | Greater than 90th | 200.0% | |
75th | 150.0% | 75th | 150.0% | ||
60th | 125.0% | 60th | 125.0% | ||
| Target | 50th | 100.0% | 50th | 100.0% | |
| 40th | 75.0% | 40th | 75.0% | ||
| 25th | 50.0% | 25th | 50.0% | ||
| Minimum | Less than 25th | 0.0% | Less than 25th | 0.0% | |
23
For performance levels between those appearing in the above tables, the number of shares to be vested and earned will be interpolated between the next closest performance levels appearing in the tables. For all grantees, the performance metrics are those of Chemed in total rather than any individual’s respective operating division. The grant recommendations were dollar-denominated; the number of share units per grantee was determined based on the closing price of the Company’s Capital Stock on the day of the Compensation Committee’s approval. The relative TSR is measured against the Peer Group.Group in effect at the time of the grant.
The following table shows the results and payouts for the performance periods completed since institution of the PSU incentive program in 2013:
| Adjusted EPS Avg. Annual CAGR | TSR Peer Group Percentile | |||||||||||||||
| Performance Period | Percent | Payout (a) | Percentile | Payout (a) | ||||||||||||
| 3-Year Performance Period Targets | 7.00 | % | 100.0 | % | 50th | 100.0 | % | |||||||||
January 1, 2013 - December 31, 2015 | 10.26 | 144.4 | 73rd | 149.8 | ||||||||||||
January 1, 2014 - December 31, 2016 | 8.23 | 118.0 | 91st | 204.6 | ||||||||||||
January 1, 2015 - December 31, 2017 | 11.79 | 163.0 | 90th | 203.9 | ||||||||||||
January 1, 2016 - December 31, 2018 | 20.52 | 203.3 | 70th | 144.0 | ||||||||||||
Adjusted EPS Avg. Annual CAGR | TSR Peer Group Percentile | ||||||||||||
Performance Period | Percent | Payout(a) | Percentile | Payout(a) | |||||||||
| 3-Year Performance Period Targets | 7.00 | % | 100.0 | % | 50th | 100.0 | % | ||||||
January 1, 2013 - December 31, 2015 | 10.26 | 144.4 | 73rd | 149.8 | |||||||||
January 1, 2014 - December 31, 2016 | 8.23 | 118.0 | 91st | 204.6 | |||||||||
January 1, 2015 - December 31, 2017 | 11.79 | 163.0 | 90th | 203.9 | |||||||||
January 1, 2016 - December 31, 2018 | 20.52 | 203.3 | 70th | 144.0 | |||||||||
January 1, 2017 - December 31, 2019 | 24.29 | 202.5 | 79th | 165.2 | |||||||||
January 1, 2018 - December 31, 2020 | 29.06 | 202.0 | 79th | 164.8 | |||||||||
January 1, 2019 - December 31, 2021 | 18.63 | 202.0 | 63rd | 131.6 | |||||||||
(a) Payout percentages are based on payout scales at the time of grant and include reinvestment of dividends paid on Chemed shares during the performance period. | |||||||||||||
In each of the 3-year performance periods completed to date, the Company’s Adjusted EPS Average Annual CAGR exceeded the target of 7.0%. The Company’s TSR for such periods also exceeded the target, at the 73rd, 91st, 90th, and 70th,79th, 79th and 63rd percentile for the 3-year periods ending in 2015, 2016, 2017, 2018, 2019, 2020 and 2018,2021, respectively.
The Compensation Committee believes the payment of long-term incentive compensation in the form of performance-based share units promotes and encourages long-term retention and service for the Company and better aligns the interests of the named executive officers with those of the Company’s stockholders through increased share ownership, promoting improved financial performance, and increased stockholder value.
Stock option and stock awards are not granted so as to “time” them before the release of material nonpublic information that is likely to result in an increase in share price (“spring-loading”) or delay them until after the release of material nonpublic information that is likely to result in a decrease in share price (“bullet-dodging”). The Company does not reprice stock option awards or replace them if the share price declines after the date such stock option awards were granted. Beginning in 2013, in the event of a change in control of the Company, all stock option and stock award incentives are subject to a double trigger vesting, requiring employment termination coupled with a change in control. The Company also adopted a clawback policy affecting incentive compensation.
24
Perquisites
The Company’s executive compensation program offers perquisites that are commonly available to senior executives, the nature and amounts of which are detailed in the “All Other Compensation Table.”
Retirement Benefits
The Company maintains the Retirement Plan, a tax-qualified defined contribution plan, for the benefit of its employees, including the named executive officers. The Retirement Plan permits employees to contribute a portion of their pay to the plan on a pre-tax basis. The Company also provides a matching contribution to employees who contribute to the plan. The named executive officers participate in the Retirement Plan within the limits imposed by the Internal Revenue Code (the “Code”) and the Employee Retirement Income Security Act (“ERISA”).
The Company also maintains the Excess Benefit Plan and the Deferred Compensation Plan, which are non-qualified supplemental savings plans for key employees, including the named executive officers, whose participation in the Retirement Plan is limited by the Code and ERISA. Messrs. McNamara, Williams, Westfall and Ms. DallobWitzeman participate in the Excess Benefit Plan and Mr. Lee participates in the Deferred Compensation Plan. These plans allow participants to defer up to 50% of their base salary and up to 85% of their annual cash incentive compensation and provide a matching contribution from the Company. Participants select mutual funds as investments, and amounts deferred and credited to participant accounts under the plans are credited with earnings or losses depending on the performance of the selected mutual funds. Participants may receive the amounts credited to their accounts at retirement, termination of employment or on a specific date following termination or retirement and may also elect to receive a portion of each year’s deferral and earnings on a specific date prior to retirement or termination of employment. Participants may receive such amounts in a lump-sum payment or in installment payments.
Each of the named executive officers other than Mr.Messrs. Westfall and Witzeman also participatesparticipate in the Supplemental Pension Plan, which provides certain key employees with a supplemental pension and optional life insurance benefit. The Company accrues a fixed monthly contribution to each participant’s account under this plan, and participants’ accounts are credited with monthly earnings based on an annual interest rate. Participants have the option to use a portion of this Company contribution to purchase supplemental term life insurance.
Tax Considerations; Loss of Certain Tax Deductions
U.S. federal income tax law prohibits the Company from taking a deduction for compensation paid to its covered executive officers over $1,000,000 per executive per year, but until December 31, 2017 exempted certain performance-based compensation. Compensation paid to covered executive officers in excess of $1,000,000 willis not be deductible thereafter, unless it qualifies for transition relief applicable to arrangements in place as of November 2, 2017. Because of our compensation structure, only a relatively small amount of compensation was applicablegranted thereafter will not be eligible for the transitional relief both in 2018 and going forward.relief. The Compensation Committee considers tax regulations, specifically including any losses of deductions due to changes in tax laws, in structuring compensation arrangements to achieve deductibility, except where outweighed by the need for flexibility, or as the Company otherwise determines is in the best interests of the Company and its stockholders.
Employment Agreements; Severance Payments; Change in Control
The Company has employment agreements with two of its named executive officers: Messrs. McNamara and Williams. On May 3, 2008, Mr. McNamara entered into a two-year employment agreement, which automatically renews every May 3 beginning May 3, 2010 for a new two-year term unless either party provides 30 days’ prior written notice of non-renewal. Mr. McNamara’s employment agreement provides for a lump-sum severance payment, in the event of termination without cause, equal to five times his then-current base salary plus a pro-rated portion of his average annual incentive compensation for the then-past three full fiscal years. In the event of termination without cause, he also would be entitled to continue to participate in the Company’s welfare benefit plans for 24 months following termination at the then-current rate of contribution. The employment agreement with Mr. Williams entered into in December 2006 contains the same terms as outlined above for Mr. McNamara, except that Mr. Williams would be entitled to a lump-sum severance payment equal to two and a half times his then-current base salary and continued participation in the Company’s welfare benefit plans for 18 months following termination at the then-current rate of contribution. Such severance payments and benefits are conditioned upon execution of a general release of claims in favor of the Company, nondisclosure and, for Mr. McNamara, two-year non-compete and non-solicitation covenants and, for Mr. Williams, one-year non-compete and non-solicitation covenants. If these payments were subject to the excise taxes imposed by Section 409A of the Code, Messrs. McNamara and Williams would be entitled to gross-up payments. The Company does not intend to enter into future employment agreements that provide for excise tax gross-ups.
25
For a termination due to death, disability or retirement, each of Messrs. McNamara and Williams would be entitled under his employment agreement to a lump-sum payment equal to the pro-rated portion of the average of his annual incentive compensation for the then-past three full fiscal years. Such severance payments under each employment agreement for a termination due to disability or retirement are conditioned upon execution of a general release of claims in favor of the Company and a nondisclosure covenant.
In 2006, the Board of Directors adopted the Chemed Corporation Senior Executive Severance Policy (as amended, supplemented or otherwise modified as of the date hereof, the “Senior Executive Severance Policy”) and the Chemed Corporation Change in Control Severance Plan (as amended, supplemented or otherwise modified as of the date hereof, the “Change in Control Plan”), which were intended to replace most of the existing employment agreements entered into by the Company. Accordingly, certain Company executives, including Messrs. Westfall, and Lee and Ms. Dallob,Witzeman, are now governed by the Senior Executive Severance Policy and the Change in Control Plan. Messrs. McNamara and Williams are not covered by the Senior Executive Severance Policy, but are covered by the Change in Control Plan. However, in the event of a change in control of the Company, Messrs. McNamara and Williams would not receive benefits under both their employment agreements and the Change in Control Plan. With the shift from individual employment agreements to general severance and change in control plans, the Compensation Committee intended to reduce total payouts to executives upon termination and move the Company’s executive severance arrangements more in line with market practices.
Under the Senior Executive Severance Policy, if an executive is terminated without cause, he or she would be entitled to a lump-sum payment equal to one and a half times his or her then-current base salary and a pro-rated portion of his or her average annual incentive compensation for the then-past three full fiscal years. Such executive would also be entitled to continued participation in the Company’s welfare benefit plans for one year following termination of employment at the then-current rate of contribution. Severance payments and benefits under the Senior Executive Severance Policy are conditioned upon execution of a general release of claims in favor of the Company. Additionally, for a termination without cause or due to disability or retirement, such severance payments and benefits are conditioned upon nondisclosure and one-year non-compete and non-solicitation covenants. This policy was revised in August 2018. Previously, if payments under the Senior Executive Severance Policy were subject to the excise taxes imposed by Section 409A of the Code, participants would be entitled to gross-up payments. Only existing participants have such entitlement; newly added plan participants do not. In the event of a change in control of the Company, participants in the Senior Executive Severance Policy would not receive benefits under both the Senior Executive Severance Policy and the Change in Control Plan. For a termination due to death, disability or retirement, each of the participants in the Senior Executive Severance Policy would be entitled to a lump-sum payment equal to the pro-rated portion of the average of his or her annual incentive compensation for the then-past three full fiscal years.
The Change in Control Plan, described in additional detail under “Change in Control of the Company” below, provides for severance payments and benefits in the event of a change in control of the Company followed within two years by an executive’s termination of employment either without cause or for good reason (“double trigger”). Payments under the Change in Control Plan are triggered by:
| a) | termination of employment by the Company without cause; or |
| b) | termination of employment by the employee within 90 days of an event giving him or her good reason to so terminate. |
26
The Change in Control Plan would provide for payments equal to three times the sum of (a) the highest base salary during the 120-day period prior to the change in control or any time following the change in control and (b) the average annual incentive compensation for the then-past three full fiscal years to Messrs. McNamara and Williams, and two times the sum of (a) the highest base salary during the 120-day period prior to the change in control or any time following the change in control and (b) the average annual incentive compensation for the then-past three full fiscal years to the other participants, all paid in cash in a lump sum within 10 days following termination. If the termination were to take place in a fiscal year other than the fiscal year during which the change in control occurred, each participant would also receive a pro-rated portion of his or her three-year average annual incentive compensation. Participants would also receive benefits under the Company’s welfare benefit plans for a period of three (for Messrs. McNamara and Williams) or two years; a lump-sum cash payment within 10 days following termination in the amount of employer contributions to defined contribution plans; perquisites for a period of three (for Messrs. McNamara and Williams) or two years; and outplacement assistance up to $25,000. Regardless of whether a participant is terminated and in addition to the severance benefits set forth above, upon a change in control, each participant in the Change in Control Plan would receive, within 10 days following the change in control, a lump-sum cash payment equal to the average of the participant’s annual incentive compensation for the then-past three full fiscal years (“single-trigger” payments). Payments under the Change in Control Plan, including single-trigger payments, are conditioned on execution of a general release of claims in favor of the Company. Prior to August 2018, if payments under the Change in Control Plan were subject to taxes imposed by Sections 4999 or 409A of the Code, participants would be entitled to gross-up payments. The plan was then amended to restrict such entitlement to then-existing participants only.
Capital Stock Ownership Guidelines
Executive ownership of Capital Stock reflects an alignment of the interests of the Company’s executives and directors with those of its stockholders. All the Company’s non-employee directors, Vice Presidents, Senior Vice Presidents, Executive Vice Presidents, Business Unit Presidents and its Chief Executive Officer are required to acquire and retain stock ownership in the Company, measured as a meaningful level of a multiple of their base salary or board retainer in shares of Capital Stock.
The Chief Executive Officer’s required Capital Stock ownership multiple is five times base salary; for the Chief Financial Officer, Executive Vice Presidents and Business Unit Presidents, four times; for Senior Vice Presidents, three times; and for Vice Presidents, two times base salary. Time-based restricted stock awards count towards Capital Stock ownership goals. Non-employee directors are required to retain five times their annual board retainer, which is $55,000,$65,000, resulting in required holdings of $275,000$325,000 in 2018.2021. These guidelines are administered by the Compensation Committee. As of December 31, 2021, Mr. McNamara currently holdsheld shares of Capital Stock with a market value of approximately 31exceeding 44 times his current base salary. All named executive officers, directors, and other executives have met their Capital Stock ownership guidelines or are pursuing plans that will permit them to achieve them within the time frame allotted by the guidelines.
Compensation Committee Report
The Compensation Committee has reviewed and discussed the Compensation Discussion and Analysis set forth above with the Company’s management. Based on these reviews and discussions, the Compensation Committee recommended to the Board of Directors that the Compensation Discussion and Analysis be included in the Company’s 20182021 Annual Report on Form 10-K and the Company’s 20192022 Proxy Statement.
George J. Walsh III, Chairman
Andrea R. Lindell
Summary Compensation Table
The following table shows the compensation paid to the Chief Executive Officer, the Chief Financial Officer and the three other most highly compensated executive officers of the Company in 2016, 20172019, 2020 and 20182021 for all services rendered in all capacities to the Company and its subsidiaries:
SUMMARY COMPENSATION TABLE
Name and Principal Position | Year | Salary ($) | Non-Equity Incentive Plan Compensation ($) | Stock Awards ($)(a) | Option Awards ($)(a) | Non-Qualified Deferred Compensation Earnings ($)(b) | All Other Compensation ($)(c) | Total ($) | |||||||||||||||||||||
| K.J. McNamara | |||||||||||||||||||||||||||||
| President and CEO | 2018 | $ | 1,149,908 | $ | 2,705,855 | $ | 1,676,824 | $ | 2,014,815 | $ | 22,299 | $ | 1,208,936 | $ | 8,778,637 | ||||||||||||||
| 2017 | 1,094,990 | 2,247,732 | 921,376 | 2,544,850 | 22,572 | 1,102,997 | 7,934,517 | ||||||||||||||||||||||
| 2016 | 1,047,013 | 1,737,761 | 628,213 | 2,064,792 | 22,509 | 1,041,041 | 6,541,329 | ||||||||||||||||||||||
| D.P. Williams | |||||||||||||||||||||||||||||
| Executive Vice | 2018 | 637,667 | 1,260,578 | 671,071 | 1,040,988 | 10,309 | 568,309 | 4,188,922 | |||||||||||||||||||||
| President and CFO | 2017 | 607,000 | 1,046,736 | 368,631 | 925,400 | 10,435 | 459,800 | 3,418,002 | |||||||||||||||||||||
| 2016 | 580,000 | 770,525 | 224,500 | 708,351 | 10,407 | 433,935 | 2,727,718 | ||||||||||||||||||||||
| N.M. Westfall (d) | |||||||||||||||||||||||||||||
| Executive Vice President | 2018 | 481,275 | 895,353 | 502,877 | 906,667 | - | 282,124 | 3,068,296 | |||||||||||||||||||||
| 2017 | 458,750 | 619,833 | 288,736 | 906,892 | - | 203,989 | 2,478,200 | ||||||||||||||||||||||
| 2016 | 404,896 | 527,963 | 89,744 | 818,640 | - | 185,308 | 2,026,551 | ||||||||||||||||||||||
| S.S. Lee | |||||||||||||||||||||||||||||
| Executive Vice President | 2018 | 429,733 | 857,600 | 360,296 | 537,284 | 10,122 | 488,022 | 2,683,057 | |||||||||||||||||||||
| 2017 | 400,333 | 797,360 | 202,504 | 416,430 | 10,248 | 328,576 | 2,155,451 | ||||||||||||||||||||||
| 2016 | 375,000 | 632,844 | 134,756 | 309,264 | 10,219 | 325,343 | 1,787,426 | ||||||||||||||||||||||
| N.C. Dallob (e) | |||||||||||||||||||||||||||||
| Vice President, | 2018 | 400,333 | 565,182 | 276,625 | 483,556 | 6,104 | 238,227 | 1,970,027 | |||||||||||||||||||||
| Secretary and Chief | 2017 | 380,000 | 469,580 | 153,277 | 397,922 | 6,179 | 176,946 | 1,583,904 | |||||||||||||||||||||
| Legal Officer | |||||||||||||||||||||||||||||
| Non-Qualified | |||||||||||||||||||||||||||||
| Non-Equity | Deferred | ||||||||||||||||||||||||||||
| Name and | Incentive Plan | Stock | Option | Compensation | All Other | ||||||||||||||||||||||||
| Principal | Salary | Compensation | Awards | Awards | Earnings | Compensation | Total | ||||||||||||||||||||||
| Position | Year | ($) | ($) | ($)(a) | ($)(a) | ($)(b) | ($)(c) | ($) | |||||||||||||||||||||
K.J. McNamara | |||||||||||||||||||||||||||||
President and CEO | 2021 | $ | 1,383,667 | 3,293,994 | 1,893,990 | 3,566,649 | 90,263 | 1,431,059 | $ | 11,659,622 | |||||||||||||||||||
| 2020 | $ | 1,305,992 | 3,065,892 | 2,168,162 | 4,021,813 | 54,566 | 1,341,998 | 11,958,423 | |||||||||||||||||||||
| 2019 | 1,217,317 | 2,409,428 | 1,702,215 | 3,411,139 | 48,969 | 1,230,782 | 10,019,850 | ||||||||||||||||||||||
D.P. Williams | |||||||||||||||||||||||||||||
Executive Vice President and CFO | 2021 | 767,667 | 1,535,001 | 728,374 | 1,802,174 | 27,861 | 607,138 | 5,468,215 | |||||||||||||||||||||
| 2020 | 724,667 | 1,429,040 | 833,909 | 1,640,471 | 25,227 | 588,554 | 5,241,868 | ||||||||||||||||||||||
| 2019 | 675,333 | 1,122,971 | 441,431 | 1,178,677 | 22,639 | 513,826 | 3,954,877 | ||||||||||||||||||||||
N.M. Westfall | |||||||||||||||||||||||||||||
Executive Vice President | 2021 | 563,646 | 805,101 | 549,551 | 1,563,383 | - | 446,092 | 3,927,773 | |||||||||||||||||||||
| 2020 | 532,854 | 1,060,122 | 625,027 | 1,495,887 | - | 514,387 | 4,228,277 | ||||||||||||||||||||||
| 2019 | 504,042 | 980,448 | 329,451 | 1,092,813 | - | 306,731 | 3,213,485 | ||||||||||||||||||||||
S.S. Lee | |||||||||||||||||||||||||||||
Executive Vice President | 2021 | 515,833 | 1,041,281 | 335,837 | 1,172,537 | 27,358 | 524,704 | 3,617,550 | |||||||||||||||||||||
| 2020 | 488,667 | 965,173 | 416,145 | 977,356 | 24,771 | 444,606 | 3,316,718 | ||||||||||||||||||||||
| 2019 | 462,867 | 532,788 | 228,614 | 702,523 | 22,231 | 448,854 | 2,397,877 | ||||||||||||||||||||||
M. D. Witzeman | |||||||||||||||||||||||||||||
Vice President and Controller | 2021 | 344,917 | 492,693 | 303,126 | 852,437 | - | 224,109 | 2,217,282 | |||||||||||||||||||||
| 2020 | 325,500 | 458,510 | 341,660 | 775,407 | - | 207,134 | 2,108,211 | ||||||||||||||||||||||
(b) Amounts represent interest earnings on balances in each named executive officer's account under the Supplemental Pension Plans that are in excess of 120% of the long-term applicable federal rate in effect in July 2021.
(c) See "All Other Compensation Table" for details.
ALL OTHER COMPENSATION TABLE
The table below describes each component of the All Other Compensation column in the Summary Compensation Table:
K.J. McNamara | D.P. Williams | N.M. Westfall | S.S. Lee | N.C. Dallob | ||||||||||||||||
Company contribution to non-qualified | ||||||||||||||||||||
deferred compensation plans | $ | 996,464 | $ | 413,179 | $ | 203,495 | $ | 345,691 | $ | 177,284 | ||||||||||
Personal use of Company aircraft (1) | 108,505 | 50,595 | 26,063 | - | 2,759 | |||||||||||||||
Company contributions to unfunded | ||||||||||||||||||||
supplemental retirement plan | 26,356 | 12,185 | - | 11,965 | 7,215 | |||||||||||||||
Company paid club memberships | 15,760 | 37,836 | 10,356 | 70,923 | 7,080 | |||||||||||||||
All other (2) | 61,851 | 54,514 | 42,210 | 59,443 | 43,889 | |||||||||||||||
Total | $ | 1,208,936 | $ | 568,309 | $ | 282,124 | $ | 488,022 | $ | 238,227 | ||||||||||
| K.J. | D.P. | N.M. | S.S. | M.D. | ||||||||||||||||
| McNamara | Williams | Westfall | Lee | Witzeman | ||||||||||||||||
Company contribution to non-qualified | ||||||||||||||||||||
| deferred compensation plans | $ | 1,121,508 | $ | 491,444 | $ | 357,859 | $ | 382,203 | $ | 163,387 | ||||||||||
Personal use of Company aircraft (1) | 116,051 | 14,263 | 9,789 | 10,775 | - | |||||||||||||||
Company paid sporting event tickets | 50,380 | 872 | 565 | - | 1,952 | |||||||||||||||
Company contributions to unfunded | ||||||||||||||||||||
| supplemental retirement plan | 26,356 | 12,185 | - | 11,965 | - | |||||||||||||||
| All other (2) | 116,764 | 88,374 | 77,879 | 119,761 | 58,770 | |||||||||||||||
Total | $ | 1,431,059 | $ | 607,138 | $ | 446,092 | $ | 524,704 | $ | 224,109 | ||||||||||
(1) The cost of the personal use of Company aircraft is calculated based on the incremental cost to the Company. Occasionally, our executives are accompanied by guests on the Company aircraft for personal reasons when there is available space on a flight being made for business reasons. There is no incremental cost associated with that guest's usage of the aircraft on these business trips.
(2) Amounts included in this line represent payments made to the NEO's or on their behalf for: contributions to 401(k) plan; the long-term care plan; term life insurance; supplemental life insurance; parking; cell phone service; personal use of the Company apartment; annual credit card fees; home utilities (mainly home internet service); annual executive physical; family member travel to Company events; personal incidentals while on business travel; expenses paid on certain personal trips and certain housing and automobile expenses. All items accumulated in this line are individually less than $25,000 or 10% of the total other compensation of the NEO, whichever is lower.
(The remainder of this page intentionally left blank)
The following table shows stock option and stock awards granted in 20182021 to the named executive officers in the Summary Compensation Table pursuant to the Stock Incentive Plans:
| All Other | All Other | ||||||||||||||||||||
| Stock Awards: | Option Awards: | ||||||||||||||||||||
| Number of | Number of | Exercise | Closing | Grant | |||||||||||||||||
| Shares of | Securities | or Base Price | Market Price | Date Fair | |||||||||||||||||
| Stock or | Underlying | of Option | on Grant | Value of | |||||||||||||||||
| Grant | Units | Options | Awards | Date | Award | ||||||||||||||||
Name | Date | (#) | (#) (a) | ($/Share) (b) | ($/Share) | ($)(c) | |||||||||||||||
K.J. McNamara | 2/19/2021 | 1,737 | - | n.a. | $ | 486.41 | $ | 1,040,532 | |||||||||||||
| 2/19/2021 | 1,737 | - | n.a. | 486.41 | 853,458 | ||||||||||||||||
| 10/28/2021 | - | 36,803 | $ | 445.35 | 447.00 | 3,566,649 | |||||||||||||||
D.P. Williams | 2/19/2021 | 668 | - | n.a. | 486.41 | 400,159 | |||||||||||||||
| 2/19/2021 | 668 | - | n.a. | 486.41 | 328,215 | ||||||||||||||||
| 10/28/2021 | - | 18,596 | $ | 445.35 | 447.00 | 1,802,174 | |||||||||||||||
N.M. Westfall | 2/19/2021 | 504 | - | n.a. | 486.41 | 301,916 | |||||||||||||||
| 2/19/2021 | 504 | - | n.a. | 486.41 | 247,635 | ||||||||||||||||
| 10/28/2021 | - | 16,132 | $ | 445.35 | 447.00 | 1,563,383 | |||||||||||||||
S.S. Lee | 2/19/2021 | 308 | - | n.a. | 486.41 | 184,504 | |||||||||||||||
| 2/19/2021 | 308 | - | n.a. | 486.41 | 151,333 | ||||||||||||||||
| 10/28/2021 | - | 12,099 | $ | 445.35 | 447.00 | 1,172,537 | |||||||||||||||
M.D. Witzeman | 2/19/2021 | 278 | - | n.a. | 486.41 | 166,533 | |||||||||||||||
| 2/19/2021 | 278 | - | n.a. | 486.41 | 136,593 | ||||||||||||||||
| 10/28/2021 | - | 8,796 | $ | 445.35 | 447.00 | 852,437 | |||||||||||||||
(a) Options have an expiration date of October 28, 2026.
| Name | Grant Date | All Other Stock Awards: Number of Shares of Stock or Units (#) | All Other Option Awards: Number of Securities Underlying Options (#) (a) | Exercise or Base Price of Option Awards ($/Share) (b) | Closing Market Price on Grant Date ($/Share) | Grant Date Fair Value of Award ($) (c) | |||||||||||||||
| K.J. McNamara | 2/16/2018 | 1,964 | - | n.a. | $ | 254.56 | $ | 670,117 | |||||||||||||
| 2/16/2018 | 1,964 | - | n.a. | 254.56 | 1,006,707 | ||||||||||||||||
| 11/2/2018 | - | 30,000 | $ | 306.70 | 306.93 | 2,014,815 | |||||||||||||||
| D.P. Williams | 2/16/2018 | 786 | - | n.a. | 254.56 | 268,183 | |||||||||||||||
| 2/16/2018 | 786 | - | n.a. | 254.56 | 402,888 | ||||||||||||||||
| 11/2/2018 | - | 15,500 | $ | 306.70 | 306.93 | 1,040,988 | |||||||||||||||
| N.M. Westfall | 2/16/2018 | 589 | - | n.a. | 254.56 | 200,967 | |||||||||||||||
| 2/16/2018 | 589 | - | n.a. | 254.56 | 301,910 | ||||||||||||||||
| 11/2/2018 | - | 13,500 | $ | 306.70 | 306.93 | 906,667 | |||||||||||||||
| S.S. Lee | 2/16/2018 | 422 | - | n.a. | 254.56 | 143,987 | |||||||||||||||
| 2/16/2018 | 422 | - | n.a. | 254.56 | 216,309 | ||||||||||||||||
| 11/2/2018 | - | 8,000 | $ | 306.70 | 306.93 | 537,284 | |||||||||||||||
| N.C. Dallob | 2/16/2018 | 324 | - | n.a. | 254.56 | 110,549 | |||||||||||||||
| 2/16/2018 | 324 | - | n.a. | 254.56 | 166,076 | ||||||||||||||||
| 11/2/2018 | - | 7,200 | $ | 306.70 | 306.93 | 483,556 | |||||||||||||||
(b) The exercise price of option awards is the average of the high and low sale prices of the New York Stock Exchange on the grant date.
(c) Amounts represent the aggregate grant date fair value of the awards determined in accordance with the FASB's stock based compensation rules. See Note 4 to the Consolidated Financial Statements included as Exhibit 13 to the Company's Annual Report on Form 10-K for a description of the assumptions used in determining the grant date fair value. | |
Narrative to Summary Compensation Table and Grants of Plan-Based Awards Table
The following is a description of material factors necessary to understand the information disclosed in the Summary Compensation Table, the All Other Compensation Table and the Grants of Plan-Based Awards Table. This discussion is meant to supplement the information contained in the Compensation Discussion and Analysis.
“Performance-Based” Compensation in Proportion to Total Compensation
In 2018,2021, the named executive officers’ “performance-based” compensation, including non equity incentive awards, option awards, and equity incentive and market-based stock awards, represented the following approximate percentages of their total compensation: Mr. McNamara – 72.9%75.1%; Mr. Williams – 71.0%74.3%; Mr. Westfall – 75.1%74.3%; Mr. Lee – 65.4%70.5%; and Ms. DallobMr. Witzeman – 67.3%74.3%. The Compensation Committee believes that this mix of compensation balances the objectives of rewarding recent results and motivating long-term performance. Additionally, in determining the appropriate combination of compensation elements, the Compensation Committee places an emphasis on stock options and performance share units in order to closely align the executives’ interests with those of the Company’s stockholders and reward stronger performance of the Company.
Employment Agreements
The Company has employment agreements with two of its named executive officers: Messrs. McNamara and Williams. On May 3, 2008, Mr. McNamara entered into a two-year employment agreement, which provided for his continued employment as a senior executive officer of the Company through May 2, 2010. Its two-year term automatically renews on each subsequent May 3 for a new two-year term unless either party provides 30 days’ prior written notice of non-renewal. The agreement provides for a base salary of $700,000 or such higher amount as the Board of Directors may determine. Mr. McNamara’s current base salary is $1,172,000.$1,406,000. Mr. McNamara’s employment agreement provides for a lump-sum severance payment, in the event of termination without cause, equal to five times his then-current base salary plus a pro-rated portion of his average annual incentive compensation for the then-past three full fiscal years. He also will be entitled to continue to participate in the Company’s welfare benefit plans for 24 months following termination at the then-current rate of contribution. Such severance payments and benefits are conditioned upon execution of a general release of claims in favor of the Company, nondisclosure and two-year non-compete and non-solicitation covenants. If such payments were subject to the excise taxes imposed by Section 409A of the Code, Mr. McNamara would be entitled to gross-up payments.
Mr. Williams’ employment agreement, entered into on December 1, 2006, provided for his employment as a senior financial executive through November 30, 2008, after which time the term of the agreement was automatically extended by one year and its two-year term automatically renews on each subsequent December 1 for a new two-year term unless either party provides 30 days’ prior written notice of non-renewal. The agreement provides for a base salary of $313,500 or such higher amount as the Board of Directors may determine. Mr. Williams’ current base salary is $650,000.$780,000.
Mr. Williams’ agreement is identical in all material respects to Mr. McNamara’s, except if he were terminated without cause, he would (a) receive a lump-sum severance payment equal to two and a half times his then-current base salary plus a pro-rated portion of his average annual incentive compensation for the then-past three full fiscal years and (b) be entitled to continue to participate in the Company’s welfare benefit plans for 18 months following termination at the then-current rate of contribution. Such severance payments and benefits are conditioned upon execution of a general release of claims in favor of the Company, nondisclosure and one-year non-compete and non-solicitation covenants. If such payments were subject to the excise taxes imposed by Section 409A of the Code, Mr. Williams would be entitled to gross-up payments.
The definition of “cause” under each of the employment agreements is set forth below under the heading “Termination Without Cause Prior to and Not in Connection With a Change in Control of the Company; Termination Due to Death, Disability or Retirement - Employment Agreements.”
For a termination due to death, disability or retirement, each of Messrs. McNamara and Williams would be entitled under his employment agreement to a lump-sum payment equal to the pro-rated portion of the average of his annual incentive compensation for the then-past three full fiscal years. Such severance payments under each employment agreement for a termination due to disability or retirement are conditioned upon execution of a general release of claims in favor of the Company and a nondisclosure covenant.
A more detailed discussion of amounts that would be payable to Messrs. McNamara and Williams upon termination is set forth below under the heading “Potential Payments to Executives Upon Termination or Change in Control.”
Annual Cash Incentives
Annual cash incentive compensation is granted by the Compensation Committee, subject to approval by the Board. For 2018,2021, annual cash incentive compensation was awarded to each of the named executive officers. The amount of the annual cash incentive compensation awards are set forth in the “Non Equity Incentive Plan Compensation” column of the Summary Compensation Table. A more detailed discussion of the criteria that the Compensation Committee considered when recommending the amount of the 20182021 cash incentive compensation is set forth in the Compensation Discussion and Analysis.
Stock Incentive Plans
The Company has three Stock Incentive Plans under which stock option awards to purchase shares of Capital Stock, performance share units, and awards of restricted and fully vested stock may be granted for a period of up to ten years to key employees: the 2010 Incentive Plan, 2015 Incentive Plan and the 2018 Incentive Plan. The Company, prior to 2013, granted stock option and restricted stock awards annually to key employees, including the named executive officers, pursuant to the Stock Incentive Plans. Since 2013, performance share units were granted rather than time-based restricted stock awards. No further time-based restricted stock awards are contemplated to be granted.
All stock option awards granted under these plans provide for a purchase price equal to the fair market value of the Capital Stock at the date granted. Fair market value is defined as the mean between the high and low sales prices of a share of Capital Stock on the New York Stock Exchange. Stock option awards granted under the Stock Incentive Plans are non-qualified and, when vested, are exercisable for fully vested shares of Capital Stock. Stock option awards granted since 2014 become exercisable in three equal installments on each of the first three anniversaries of the date such awards were granted. Vested stock option awards remain exercisable for three months followingterminate on the termination of the holder’s employment, if the Compensation Committee so specifically consents, except for termination due to death, incapacity, retirement, or retirement,if the Compensation Committee specifically consents, in which case vested stock option awards remain exercisable for 15 months following termination. Unvested stock option awards are forfeited upon termination of employment for any reason other than death, disability, retirement or retirement,if the Compensation Committee specifically consents, in which case unvested option awards are forfeited three months after termination. All unvested stock option awards granted prior to 2013 held by employees will accelerate and vest upon a change in control of the Company. Those stock option awards granted in 2013 and later only accelerate and vest upon both a change in control of the Company and the employee’s employment termination without good cause or for good reason. Stock options granted prior to 2015 expire ten years after grant; those granted in 2015 or later expire five years after the grant.
Performance share units, which are granted annually in February, 2015 for 2015-2017, in February 2016 for 2016-2018, in February 2017 for 2017-2019, and in February 2018 for 2018-2020, are payable on achievement of three-year performance-based targets and continued employment through the date on which the Compensation Committee determines the number of shares to be delivered, after December 31 and before March 15, respectively. Holders of share units do not receive dividends during the performance period on unvested awards; rather, dividends accruing during the performance period are paid in the form of additional shares only if the underlying awards have been earned and vested. If the recipient’s employment terminates due to death, disability or retirement, their units vest and he or she earns a pro-rated number of shares. If their employment terminates for another reason, all restrictedperformance share units are forfeited. Upon a change in control of the Company, replacement awards are to be issued. If such change in control is followed by a termination of employment other than for good cause or for good reason, the restrictedperformance share units vest.
Other Plans
The named executive officers participate in various plans that are generally available to the employees of the Company, including the Retirement Plan, which is a tax-qualified defined contribution plan, and the Company’s welfare benefit plans. In addition, the Company has several non-qualified supplemental savings plans for key employees (including each of the named executive officers) whose participation in the Retirement Plan is limited by rules imposed by the Code and ERISA. These non-qualified supplemental savings plans are discussed in greater detail in the narrative that follows the Nonqualified Deferred Compensation Table. The contributions of the Company which were credited into these plans in 20182021 on behalf of each of the named executive officers are set forth in the Nonqualified Deferred Compensation Table.
32
Eligible employees, including each of the named executive officers except Mr. Westfall and Mr. Witzeman, also participate in the Supplemental Pension Plan. This is a supplemental defined contribution plan discussed in greater detail in the narrative that follows the Nonqualified Deferred Compensation Table. Each named executive officer’s accrual of benefits under this plan for 20182021 is set forth in the Nonqualified Deferred Compensation Table.
(The remainder of this page intentionally left blank)
Outstanding Equity Awards at Year End
The following table shows outstanding equity awards at 20182021 year end held by the named executive officers in the Summary Compensation Table:
OUTSTANDING EQUITY AWARDS AT YEAR END 20182021
| Name | Option Awards | Stock Awards | ||||||
Number of Securities Underlying Unexercised Options (#) Exercisable | Number of Securities Underlying Unexercised Options (#) Unexercisable | Option Exercise Price ($) | Option Expiration Date | Number of Shares or Units of Stock That Have Not Vested (#) | Market Value Of Shares or Units of Stock That Have Not Vested (g) ($) | |||
K.J. McNamara | 30,899 | - | 70.30 | 11/8/2023 | - | - | ||
| 30,000 | - | 157.36 | 11/6/2020 | - | - | |||
| 58,033 | 30,267 | (a) | 135.85 | 11/4/2021 | - | - | ||
| 18,333 | 36,667 | (b) | 231.91 | 11/3/2022 | - | - | ||
| - | 30,000 | (c) | 306.70 | 11/2/2023 | - | - | ||
| - | - | - | n.a. | 5,530 | (d) | 1,566,538 | ||
| - | - | - | n.a. | 4,314 | (e) | 1,222,070 | ||
| - | - | - | n.a. | 3,928 | (f) | 1,112,724 | ||
D.P. Williams | 24,000 | - | 106.59 | 11/7/2024 | - | - | ||
| 8,000 | - | 157.36 | 11/6/2020 | - | - | |||
| 20,766 | 10,384 | (a) | 135.85 | 11/4/2021 | - | - | ||
| 6,666 | 13,334 | (b) | 231.91 | 11/3/2022 | - | - | ||
| - | 15,500 | (c) | 306.70 | 11/2/2023 | - | - | ||
| - | - | - | n.a. | 1,976 | (d) | 559,761 | ||
| - | - | - | n.a. | 1,726 | (e) | 488,941 | ||
| - | - | - | n.a. | 1,572 | (f) | 445,316 | ||
| N.M. Westfall | 12,000 | 12,000 | (a) | 135.85 | 11/4/2021 | - | - | |
| 6,533 | 13,067 | (b) | 231.91 | 11/3/2022 | - | - | ||
| - | 13,500 | (c) | 306.70 | 11/2/2023 | - | - | ||
| - | - | - | n.a | 790 | (d) | 223,791 | ||
| - | - | - | n.a. | 1,352 | (e) | 382,995 | ||
| - | - | - | n.a. | 1,178 | (f) | 333,704 | ||
| Option Awards | Stock Awards | ||||||||||||||||||||
| Number of | Number of | Number of | Market Value | ||||||||||||||||||
| Securities | Securities | Shares or Units | Of Shares | ||||||||||||||||||
| Underlying | Underlying | of Stock | or Units of | ||||||||||||||||||
| Unexercised | Unexercised | Option | That Have | Stock | |||||||||||||||||
| Options | Options | Exercise | Option | Not | That Have Not | ||||||||||||||||
| (#) | (#) | Price | Expiration | Vested | Vested (g) | ||||||||||||||||
| Name | Exercisable | Unexercisable | ($) | Date | (#) | ($) | |||||||||||||||
K.J. McNamara | 30,000 | - | 306.70 | 11/2/2023 | - | - | |||||||||||||||
29,133 | 14,567 | (a) | 413.19 | 10/29/2024 | - | - | |||||||||||||||
13,741 | 27,483 | (b) | 471.74 | 10/29/2025 | - | - | |||||||||||||||
- | 36,803 | (c) | 445.35 | 10/28/2026 | - | - | |||||||||||||||
- | - | - | n.a. | 4,928 | (d) | 2,607,109 | |||||||||||||||
- | - | - | n.a. | 2,678 | (e) | 1,416,769 | |||||||||||||||
- | - | - | n.a. | 3,474 | (f) | 1,837,885 | |||||||||||||||
D.P. Williams | 24,000 | - | 106.59 | 11/7/2024 | - | - | |||||||||||||||
20,000 | - | 231.91 | 11/3/2022 | - | - | ||||||||||||||||
15,500 | - | 306.70 | 11/2/2023 | - | - | ||||||||||||||||
10,066 | 5,034 | (a) | 413.19 | 10/29/2024 | - | - | |||||||||||||||
5,605 | 11,210 | (b) | 471.74 | 10/29/2025 | - | - | |||||||||||||||
- | 18,596 | (c) | 445.35 | 10/28/2026 | - | - | |||||||||||||||
- | - | - | n.a. | 1,278 | (d) | 676,113 | |||||||||||||||
- | - | - | n.a. | 1,030 | (e) | 544,911 | |||||||||||||||
- | - | - | n.a. | 1,336 | (f) | 706,797 | |||||||||||||||
N.M. Westfall | 13,500 | - | 306.70 | 11/2/2023 | - | - | |||||||||||||||
9,333 | 4,667 | (a) | 413.19 | 10/29/2024 | - | - | |||||||||||||||
5,111 | 10,222 | (b) | 471.74 | 10/29/2025 | - | - | |||||||||||||||
- | 16,132 | (c) | 445.35 | 10/28/2026 | - | - | |||||||||||||||
- | - | - | n.a. | 954 | (d) | 504,704 | |||||||||||||||
- | - | - | n.a. | 772 | (e) | 408,419 | |||||||||||||||
- | - | - | n.a. | 1,008 | (f) | 533,272 | |||||||||||||||
S.S. Lee | 13,000 | - | 106.59 | 11/7/2024 | - | - | |||||||||||||||
8,000 | - | 306.70 | 11/2/2023 | - | - | ||||||||||||||||
6,000 | 3,000 | (a) | 413.19 | 10/29/2024 | - | - | |||||||||||||||
3,339 | 6,679 | (b) | 471.74 | 10/29/2025 | - | - | |||||||||||||||
- | 12,099 | (c) | 445.35 | 10/28/2026 | - | - | |||||||||||||||
- | - | - | n.a. | 662 | (d) | 350,224 | |||||||||||||||
- | - | - | n.a. | 514 | (e) | 271,927 | |||||||||||||||
- | - | - | n.a. | 616 | (f) | 325,889 | |||||||||||||||
M.D. Witzeman | 6,900 | - | 306.70 | 11/2/2023 | - | - | |||||||||||||||
4,666 | 2,334 | (a) | 413.19 | 10/29/2024 | - | - | |||||||||||||||
2,649 | 5,299 | (b) | 471.74 | 10/29/2025 | - | - | |||||||||||||||
- | 8,796 | (c) | 445.35 | 10/28/2026 | - | - | |||||||||||||||
- | - | - | n.a. | 538 | (e) | 284,624 | |||||||||||||||
- | - | - | n.a. | 422 | (e) | 223,255 | |||||||||||||||
- | - | - | n.a. | 556 | (f) | 294,146 | |||||||||||||||
Name | Option Awards | Stock Awards | ||||||
Number of Securities Underlying Unexercised Options (#) Exercisable | Number of Securities Underlying Unexercised Options (#) Unexercisable | Option Exercise Price ($) | Option Expiration Date | Number of Shares or Units of Stock That Have Not Vested (#) | Market Value Of Shares or Units of Stock That Have Not Vested (g) ($) | |||
S.S. Lee | 13,000 | - | 106.59 | 11/7/2024 | - | - | ||
| 12,500 | - | 157.36 | 11/6/2020 | - | - | |||
| 9,066 | 4,534 | (a) | 135.85 | 11/4/2021 | - | - | ||
| 3,000 | 6,000 | (b) | 231.91 | 11/3/2022 | - | - | ||
| - | 8,000 | (c) | 306.70 | 11/2/2023 | - | - | ||
| - | - | - | n.a. | 1,186 | (d) | 335,970 | ||
| - | - | - | n.a. | 948 | (e) | 268,549 | ||
| - | - | - | n.a. | 844 | (f) | 239,088 | ||
| N.C. Dallob | - | 4,834 | (a) | 135.85 | 11/4/2021 | - | - | |
| - | 5,734 | (b) | 231.91 | 11/3/2022 | - | - | ||
| - | 7,200 | (c) | 306.70 | 11/2/2023 | - | - | ||
| - | - | - | n.a. | 790 | (d) | 223,791 | ||
| - | - | - | n.a. | 718 | (e) | 203,395 | ||
| - | - | - | n.a. | 648 | (f) | 183,565 | ||
(b) Half of the remaining stock option award will vest on October 29, 2022 and the remainder on October 29, 2023.
(f) Award vests upon attainment of certain return or earnings targets on or prior to December 31, 2023. (g) Amounts are based on the $529.04 closing price of the Capital Stock on December 31, 2021. |
34
Stock Option Award Exercises and Stock Awards Vested
The table below shows information concerning the exercise of stock option awards and vesting of restricted stock awards during 20182021 for the named executive officers in the Summary Compensation Table:
OPTION EXERCISES AND STOCK VESTED IN 20182021
| Option Awards | Stock Awards | |||||||||||||||||||||||
| Number of | Number of | |||||||||||||||||||||||
| Shares | Value | Shares | Value | |||||||||||||||||||||
| Acquired on | Realized on | Acquired on | Realized on | |||||||||||||||||||||
| Option Awards | Stock Awards | Exercise | Exercise | Vesting | Vesting | |||||||||||||||||||
Name | Number of Shares Acquired on Exercise (#) | Value Realized on Exercise ($) | Number of Shares Acquired on Vesting (#) | Value Realized on Vesting ($) | (#) | ($) | (#) | ($) | ||||||||||||||||
K.J. McNamara | 132,500 | $ | 24,577,150 | 13,752 | $ | 3,709,876 | 40,000 | $ | 10,778,540 | 7,203 | $ | 3,539,122 | ||||||||||||
D.P. Williams | 63,756 | 14,070,144 | 5,054 | 1,372,530 | 10,384 | 3,621,835 | 2,883 | 1,416,533 | ||||||||||||||||
| N.M. Westfall | 30,919 | 5,617,219 | 1,799 | 499,686 | 12,073 | 3,052,146 | 2,161 | 1,061,786 | ||||||||||||||||
S.S. Lee | - | - | 3,100 | 846,018 | 9,000 | 2,412,990 | 1,547 | 760,103 | ||||||||||||||||
N.C. Dallob | 11,732 | 1,685,889 | 2,021 | 548,858 | ||||||||||||||||||||
M.D. Witzeman | - | - | 1,082 | 531,630 | ||||||||||||||||||||
(The remainder of this page intentionally left blank)
35
Nonqualified Defined Contribution and other Nonqualified Deferred Compensation Plans
The table below shows information concerning compensation deferred under the Excess Benefit Plan, the Deferred Compensation Plan, and the Supplemental Pension Plan during 20182021 by each of the named executive officers in the Summary Compensation Table:
NONQUALIFIED DEFERRED COMPENSATION IN 20182021
| Executive | Registrant | Aggregate | Aggregate | ||||||||||||||||||||||||||
| Contributions | Contributions | Earnings | Balance | ||||||||||||||||||||||||||
| in Last FY | in Last FY | in Last FY | at Last FYE | ||||||||||||||||||||||||||
Name | Executive Contributions in Last FY ($) | Registrant Contributions in Last FY ($)(a)(b) | Aggregate Earnings in Last FY ($) | Aggregate Balance at Last FYE ($)(b) | ($) | ($)(a)(b) | ($) | ($)(b) | |||||||||||||||||||||
| K.J. McNamara | |||||||||||||||||||||||||||||
| Excess Benefit Plan | $ | - | $ | 989,039 | $ | 378,169 | $ | 22,079,548 | $ | - | $ | 1,121,508 | $ | 1,067,408 | $ | 37,908,377 | |||||||||||||
| Supplemental Pension and Life Insurance Plan | - | 26,356 | 44,116 | 663,327 | - | 26,356 | 90,263 | 936,193 | |||||||||||||||||||||
| D.P. Williams | |||||||||||||||||||||||||||||
| Excess Benefit Plan | 316,290 | 405,754 | (433,752 | ) | 6,595,952 | 773,414 | 491,444 | 104,620 | 9,631,589 | ||||||||||||||||||||
| Supplemental Pension and Life Insurance Plan | - | 12,185 | 20,396 | 306,673 | - | 12,185 | 27,861 | 418,955 | |||||||||||||||||||||
| N.M. Westfall | |||||||||||||||||||||||||||||
| Excess Benefit Plan | - | 196,070 | (36,439 | ) | 752,333 | - | 357,859 | 340,785 | 2,541,314 | ||||||||||||||||||||
| Supplemental Pension and Life Insurance Plan | - | - | - | - | - | - | |||||||||||||||||||||||
| S.S. Lee | |||||||||||||||||||||||||||||
| Roto-Rooter Deferred Compensation Plan | 100,099 | 345,691 | (426,199 | ) | 5,755,187 | - | 382,203 | 1,042,987 | 12,459,722 | ||||||||||||||||||||
| Supplemental Pension and Life Insurance Plan | - | 11,965 | 20,027 | 301,137 | - | 11,965 | 27,358 | 411,392 | |||||||||||||||||||||
| N.C. Dallob | |||||||||||||||||||||||||||||
M.D. Witzeman | |||||||||||||||||||||||||||||
| Excess Benefit Plan | - | 169,859 | 205,161 | 3,828,498 | - | 163,387 | 200,479 | 2,026,337 | |||||||||||||||||||||
| Supplemental Pension and Life Insurance Plan | - | 7,215 | 12,075 | 181,577 | - | - | - | - | |||||||||||||||||||||
(a) Amounts reported in All Other Compensation Table for 2021.
The Excess Benefit Plan and the Deferred Compensation Plan
Each of the named executive officers participate in either the Excess Benefit Plan or the Deferred Compensation Plan (collectively, the “Plans”). The Plans are non-qualified supplemental savings plans that allow participants to defer up to 50% of their base salary and up to 85% of their annual cash incentive compensation. The Plans also provide the participants with Company matching contributions which would have been received in the tax-qualified Retirement Plan had the participant’s participation in the Retirement Plan not been limited by rules imposed under the Code and ERISA. The Plans offer only mutual funds as investment options for participant contributions. Participants select the mutual funds as investments, and amounts deferred and credited to participant accounts under the Plans are credited with earnings or losses depending on the performance of the selected mutual funds. Participants can change their investment options for both future deferrals and current account balances at any time. The earnings credited to the accounts of participants are equal to the actual earnings from the mutual funds in which the participants elect to invest.
36
The table below shows the funds available under the Excess Benefit Plan and the Roto-Rooter Deferred Compensation Plan and their annual rates of return for the calendar year ended December 31, 2018,2021, as reported by the administrator of the Plans.
| Name of Fund | Rate of Return | Name of Fund | Rate of Return | ||||||
| American Europacific Growth Fund | 2.80 | % | Merrill Lynch Conservative Model Portfolio | 2.63 | % | ||||
| American Washington | 28.90 | % | Merrill Lynch Moderate Model Portfolio | 11.06 | % | ||||
| Chemed Corporation Common Stock | -0.38 | % | Merrill Lynch Moderate/Aggressive Model Portfolio | 14.77 | % | ||||
| Columbia Midcap Index Fund | 24.44 | % | Merrill Lynch Moderate/Conservative Model Portfolio | 6.55 | % | ||||
| Dodge and Cox Income | -0.91 | % | MFS International Divs Fund R6 | 7.78 | % | ||||
| Hartford Mid Cap Fund | 9.90 | % | Pimco Low Duration Fund | -0.68 | % | ||||
| Invesco Oppenheimer Global | 15.63 | % | Pimco Real Return Bond Fund | 5.59 | % | ||||
| Invesco Real Estate Fund | 41.49 | % | PGIM Global Total Return | -5.73 | % | ||||
| Ishares S&P 500 Index | 28.65 | % | Supplemental Pension and Life | 7.00 | % | ||||
| Lord Abbett Developing Growth Fund | -2.41 | % | Vanguard Small Cap Fund | 28.09 | % | ||||
| Mainstay Large Cap Growth Fund | 24.81 | % | Vanguard Federal Money Market | 0.01 | % | ||||
| Merrill Lynch Aggressive Model Portfolio | 18.91 | % | Victory Sycamore Fund | 31.91 | % | ||||
| Name of Fund | Rate of Return | Name of Fund | Rate of Return |
| American Europacific Growth Fund | -14.95% | Merrill Lynch Moderate Model Portfolio | -6.12% |
| Chemed Corporation Common Stock | 17.01% | Merrill Lynch Moderate/Aggressive Model Portfolio | -7.84% |
| Columbia Midcap Index Fund | -11.33% | Merrill Lynch Moderate/Conservative Model Portfolio | -3.91% |
| Dodge and Cox Income | -0.31% | MFS International Divs Fund R6 | -10.92% |
| Hartford Mid Cap Fund | -7.32% | Oppenheimer Global Fund | -13.36% |
| Invesco Growth and Income Fund | -13.24% | Pimco Low Duration Fund | 0.51% |
| Invesco Real Estate Fund | -5.28% | Pimco Real Return Bond Fund | -1.98% |
| Ishares S&P 500 Index | -4.38% | Templeton Global Bond Fund | 1.44% |
| Lord Abbett Developing Growth Fund | 5.37% | Supplemental Pension and Life | 7.00% |
| Mainstay Large Cap Growth Fund | 3.74% | Vanguard Small Cap Fund | -12.23% |
| Merrill Lynch Aggressive Model Portfolio | -9.92% | Vanguard Federal Money Market | 1.78% |
| Merrill Lynch Conservative Model Portfolio | -1.35% | Victory Sycamore Fund | -9.96% |
Prior to making deferrals in the Plans, participants must specify the date and manner in which they wish to receive their distribution from the Plans. Participants may receive the amounts credited to their accounts at retirement, termination of employment or on a specific date following termination or retirement. Participants must also elect whether to receive distributions in a lump sum or in installment payments. Participants may elect to receive some or all of each year’s deferral and related earnings on a specific date prior to retirement or termination of employment (“In-Service Distribution”). In order to satisfy the requirements of Section 409A of the Code, certain “key employees” may not receive a distribution from the Plans until six months following a separation from service. In-Service Distributions are not subject to the six-month delay.
Messrs. McNamara, Williams, Westfall, and Ms. DallobWitzeman received Company contributions in the Excess Benefit Plan and Mr. Lee received Company contributions in the Roto-Rooter Deferred Compensation Plan for the plan year 20182021 in the amounts set forth in the Nonqualified Deferred Compensation Table. Also as set forth in the Nonqualified Deferred Compensation Table, Mr. Williams elected to defer a portion of his 20182021 compensation to the Excess Benefit Plan and has also received Company contributions in such plan, and Mr. Lee elected to defer a portion of his 2018 compensation to the Roto-Rooter Deferred Compensation Plan and has also received Company contributions in such plan.Plan.
Supplemental Pension Plan
The Supplemental Pension Plan is an unfunded defined contribution plan that provides certain key employees with a supplemental pension and an optionaloption life insurance benefit. Participants’ accounts are credited with a fixed monthly Company contribution. Participants have the option to use a portion of this Company contribution to purchase supplemental term life insurance. The Supplemental Pension Plan does not allow for employee contributions or deferrals. The participants’ accounts are credited with monthly earnings based on an annual interest rate. This interest rate is subject to change once a year. Currently this interest rate is 7.0%. All of the named executive officers except Mr.Messrs. Westfall and Witzeman are participants in the Supplemental Pension Plan.
Potential Payment to Executives Upon Termination or Change in Control
The following table represents the amounts of compensation that would be due to each of the named executive officers upon each of the listed scenarios pursuant to the Company’s plans and agreements, as if such event had occurred on December 31, 2018.2021. The amounts shown are estimates of the amounts that would be payable in each circumstance, and the actual amounts payable will only be determined upon the actual occurrence of such event.
37
| CHEMED CORPORATION | ||||||||||||||||||||
| SUMMARY OF PAYOUTS UNDER CONTRACT/SEVERANCE/CONTROL AGREEMENTS | ||||||||||||||||||||
| AS OF DECEMBER 31, 2021 | ||||||||||||||||||||
| K.J. | D.P. | N.M. | S.S. | M.D. | ||||||||||||||||
| McNamara | Williams | Westfall | Lee | Witzeman | ||||||||||||||||
| Termination Without Cause | ||||||||||||||||||||
Severance payment (a) | $ | 7,030,000 | $ | 1,950,000 | $ | 862,500 | $ | 788,625 | $ | 525,750 | ||||||||||
Pro-rated annual incentive | ||||||||||||||||||||
compensation (b) | 2,727,058 | 1,270,863 | 978,641 | 785,187 | 407,753 | |||||||||||||||
Welfare benefit continuation (c) | 29,588 | 37,484 | 25,394 | 27,027 | 10,676 | |||||||||||||||
| Total | $ | 9,786,646 | $ | 3,258,347 | $ | 1,866,535 | $ | 1,600,839 | $ | 944,179 | ||||||||||
| Involuntary Termination for Cause or | ||||||||||||||||||||
| Voluntary Termination | ||||||||||||||||||||
Severance payment | - | - | - | - | - | |||||||||||||||
Welfare benefit continuation | - | - | - | - | - | |||||||||||||||
| Total | - | - | - | - | - | |||||||||||||||
| Termination due to Death or Disability | ||||||||||||||||||||
Pro-rated annual incentive | ||||||||||||||||||||
compensation (b) | $ | 2,727,058 | $ | 1,270,863 | $ | 978,641 | $ | 785,187 | $ | 407,753 | ||||||||||
Welfare benefit continuation | - | - | - | - | - | |||||||||||||||
| Total | $ | 2,727,058 | $ | 1,270,863 | $ | 978,641 | $ | 785,187 | $ | 407,753 | ||||||||||
| Termination due to Retirement | ||||||||||||||||||||
Pro-rated annual incentive | ||||||||||||||||||||
compensation (b) | $ | 2,727,058 | $ | 1,270,863 | $ | 978,641 | $ | 785,187 | $ | 407,753 | ||||||||||
Welfare benefit continuation | - | - | - | - | - | |||||||||||||||
| Total | $ | 2,727,058 | $ | 1,270,863 | $ | 978,641 | $ | 785,187 | $ | 407,753 | ||||||||||
| Change in Control with No Termination | ||||||||||||||||||||
Annual incentive compensation | ||||||||||||||||||||
payment (b) | $ | 2,727,058 | $ | 1,270,863 | $ | 978,641 | $ | 785,187 | $ | 407,753 | ||||||||||
Distribution of Performance awards (i) | 3,254,654 | 1,251,709 | 941,691 | 597,815 | 517,401 | |||||||||||||||
280G Gross-up payment (e) | - | - | - | - | - | |||||||||||||||
| Total | $ | 5,981,712 | $ | 2,522,572 | $ | 1,920,332 | $ | 1,383,002 | $ | 925,154 | ||||||||||
| Qualifying Termination following or in | ||||||||||||||||||||
| connection with a Change in Control | ||||||||||||||||||||
Severance payment (f) | $ | 12,399,174 | $ | 6,152,589 | $ | 3,107,282 | $ | 2,621,874 | $ | 1,516,506 | ||||||||||
Annual incentive compensation | ||||||||||||||||||||
payment (b) | 2,727,058 | 1,270,863 | 978,641 | 785,187 | 407,753 | |||||||||||||||
Welfare benefit continuation and | ||||||||||||||||||||
perquisite continuation and | ||||||||||||||||||||
outplacement assistance (g) | 821,512 | 308,509 | 183,454 | 259,626 | 111,582 | |||||||||||||||
Company contribution to deferred | ||||||||||||||||||||
compensation plans (h) | 3,508,842 | 1,576,137 | 759,218 | 830,792 | 370,274 | |||||||||||||||
Accelerated vesting of stock options (d) | 8,817,352 | 3,686,060 | 3,310,012 | 2,281,696 | 1,732,229 | |||||||||||||||
Distribution of performance awards (i) | 3,254,654 | 1,251,709 | 941,691 | 597,815 | 517,401 | |||||||||||||||
280G Gross-up payment (e) | - | - | - | - | - | |||||||||||||||
| Total | $ | 31,528,592 | $ | 14,245,867 | $ | 9,280,298 | $ | 7,376,990 | $ | 4,655,745 | ||||||||||
K.J. McNamara | D.P. Williams | N.M. Westfall | S.S. Lee | N.C. Dallob | ||||||||||||||||
| Termination Without Cause | ||||||||||||||||||||
| Severance payment (a) | $ | 5,860,000 | $ | 1,625,000 | $ | 739,350 | $ | 660,900 | $ | 612,000 | ||||||||||
| Pro-rated annual incentive | ||||||||||||||||||||
| compensation (b) | 1,965,797 | 887,858 | 556,228 | 690,178 | 375,364 | |||||||||||||||
| Welfare benefit continuation (c) | 27,998 | 34,061 | 21,748 | 20,005 | 20,110 | |||||||||||||||
| Total | $ | 7,853,795 | $ | 2,546,919 | $ | 1,317,326 | $ | 1,371,083 | $ | 1,007,474 | ||||||||||
| Involuntary Termination for Cause or | ||||||||||||||||||||
| Voluntary Termination | ||||||||||||||||||||
| Severance payment | - | - | - | - | - | |||||||||||||||
| Welfare benefit continuation | - | - | - | - | - | |||||||||||||||
Total | - | - | - | - | - | |||||||||||||||
| Termination due to Death or Disability | ||||||||||||||||||||
Pro-rated annual incentive | ||||||||||||||||||||
| compensation (b) | $ | 1,965,797 | $ | 887,858 | $ | 556,228 | $ | 690,178 | $ | 375,364 | ||||||||||
| Welfare benefit continuation | - | - | - | - | - | |||||||||||||||
| Total | $ | 1,965,797 | $ | 887,858 | $ | 556,228 | $ | 690,178 | $ | 375,364 | ||||||||||
| Termination due to Retirement | ||||||||||||||||||||
Pro-rated annual incentive | ||||||||||||||||||||
compensation (b) | $ | 1,965,797 | $ | 887,858 | $ | 556,228 | $ | 690,178 | $ | 375,364 | ||||||||||
| Welfare benefit continuation | - | - | - | - | - | |||||||||||||||
| Total | $ | 1,965,797 | $ | 887,858 | $ | 556,228 | $ | 690,178 | $ | 375,364 | ||||||||||
| Change in Control with No Termination | ||||||||||||||||||||
| Annual incentive compensation | ||||||||||||||||||||
payment (b) | $ | 1,965,797 | $ | 887,858 | $ | 556,228 | $ | 690,178 | $ | 375,364 | ||||||||||
| Accelerated vesting of stock option and | ||||||||||||||||||||
| restricted stock awards | - | - | - | - | - | |||||||||||||||
| Distribution of Performance awards (i) | 1,723,759 | 689,787 | 525,201 | 373,363 | 285,263 | |||||||||||||||
| 280G Gross-up payment (e) | - | - | - | - | - | |||||||||||||||
| Total | $ | 3,689,556 | $ | 1,577,645 | $ | 1,081,429 | $ | 1,063,541 | $ | 660,627 | ||||||||||
| Qualifying Termination following or in | ||||||||||||||||||||
| connection with a Change in Control | ||||||||||||||||||||
| Severance payment (f) | $ | 9,413,391 | $ | 4,613,574 | $ | 2,098,256 | $ | 2,261,556 | $ | 1,566,728 | ||||||||||
| Annual incentive compensation | ||||||||||||||||||||
| payment (b) | 1,965,797 | 887,858 | 556,228 | 690,178 | 375,364 | |||||||||||||||
| Welfare benefit continuation and | ||||||||||||||||||||
| perquisite continuation and | ||||||||||||||||||||
| outplacement assistance (g) | 599,794 | 452,509 | 164,858 | 283,004 | 115,346 | |||||||||||||||
| Company contribution to deferred | ||||||||||||||||||||
| compensation plans (h) | 3,130,335 | 1,337,967 | 448,240 | 771,412 | 410,248 | |||||||||||||||
| Accelerated vesting of stock option | ||||||||||||||||||||
| awards (d) | 6,345,848 | 2,215,881 | 2,440,412 | 976,668 | 1,007,233 | |||||||||||||||
| Distribution of performance awards (i) | 1,723,759 | 689,787 | 525,201 | 373,363 | 285,263 | |||||||||||||||
| 280G Gross-up payment (e) | - | - | 1,788,706 | - | - | |||||||||||||||
| Total | $ | 23,178,924 | $ | 10,197,576 | $ | 8,021,901 | $ | 5,356,181 | $ | 3,760,182 | ||||||||||
(a) | The amounts shown are based on the following base salaries as of December 31, |
(b) | The pro-rated annual incentive compensation is based on the average of the prior three years annual incentive compensation |
38
(c) | The amounts shown consist of, for the period specified in the employment agreements of Messrs. McNamara and Williams, or, for Messrs. Lee, Westfall and |
(d) | The value of each stock option award subject to acceleration was determined by multiplying the number of stock option awards by the excess, if any, of |
(e) | The amount of the excise taxes imposed pursuant to Section 4999 of the Code was determined by multiplying by 20% the “excess parachute payment” that would arise in connection with payments made to the applicable named executive officer upon the triggering event. The excess parachute payment was determined in accordance with the provisions of Section 280G of the Code. The amount of the gross-up payment to make each named executive officer whole on an after-tax basis for the excise taxes imposed under Section 4999 of the Code was determined assuming a federal tax rate of 37% and 5.0% state tax rate for each named executive |
(f) | The severance payment is equal to: for each of Messrs. McNamara and Williams, three times the sum of his current base salary and average annual incentive compensation for the |
(g) | The amounts shown assume that Messrs. McNamara and Williams elect to receive their severance benefits under the Change in Control Plan, which will result in each receiving greater benefits than he would be entitled to receive under his employment agreement. Accordingly, the amounts shown consist of, for the period specified in the Change in Control Plan, (i) the continued provision of the perquisites (if any) listed in the All Other Compensation Table at |
(h) | The amounts shown equal the amount of Company contributions that would have been made on the executive’s behalf in the Company’s qualified and non-qualified defined contribution plans had the executive continued participation in such plans, at the level in effect on December 31, |
(i) | The amounts shown are the December 31, |
(j) | Payouts for performance share units are forfeited in the event of a termination other than for death, disability, or retirement other than in connection with a change in control. In the case of a termination for death, disability, or retirement, the event does not change any of the original payment terms of the awards. |
Termination Without Cause Prior to and Not in Connection With a Change in Control of the Company; Termination Due to Death, Disability or Retirement
Employment Agreements
The Company has entered into employment agreements with each of Messrs. McNamara and Williams. Pursuant to the terms of these agreements, each would be entitled to cash severance benefits if his employment was terminated without cause or due to termination of his employment by reason of his death, disability or retirement.
For a termination without cause, Mr. McNamara would be entitled to a lump-sum payment equal to five times his then-current base salary plus a pro-rated portion of his average annual incentive compensation for the then-past three full fiscal years, and Mr. Williams would be entitled to a lump-sum payment equal to two and a half times his then-current base salary plus a pro-rated portion of his average annual incentive compensation for the then-past three full fiscal years. Mr. McNamara would also be entitled to continue to participate in the Company’s welfare benefit plans for 24 months following termination at the then-current rate of contribution. Mr. Williams would be entitled to continue to participate in the Company’s welfare benefit plans for 18 months following termination at the then-current rate of contribution. Such severance payments and benefits are conditioned upon execution of a general release of claims in favor of the Company, nondisclosure and, for Mr. McNamara, two-year non-compete and non-solicitation covenants and, for Mr. Williams, one-year non-compete and non-solicitation covenants.
39
The definition of “cause” pursuant to the employment agreements is (a) the willful and repeated failure of the executive to substantially perform his duties, other than a failure resulting from physical or mental illness; (b) the executive’s conviction of, or plea of guilty or nolo contendere to, a felony which is materially and demonstrably injurious to the Company; or (c) the executive’s engagement in willful gross misconduct or gross negligence in connection with his employment.
For a termination due to death, disability or retirement, each of Messrs. McNamara and Williams would be entitled to a lump-sum payment equal to the pro-rated portion of the average of his annual incentive compensation for the then-past three full fiscal years. Such severance payments under each employment agreement for a termination due to disability or retirement are conditioned upon execution of a general release of claims in favor of the Company and a nondisclosure covenant.
If the payments set forth above were subject to the excise taxes imposed by Section 409A of the Code, Messrs. McNamara and Williams would be entitled to a gross-up payment. For purposes of the quantification of possible payments due to Messrs. McNamara and Williams in each of the scenarios set forth in the table above, it is assumed that no excise taxes pursuant to Section 409A of the Code would be imposed. As such, the amounts in the table under the heading “Qualifying Termination following or in connection with a Change in Control” do not reflect a gross-up payment with respect to any excise tax pursuant to Section 409A of the Code.
Senior Executive Severance Policy
The Senior Executive Severance Policy, described in more detail in the Compensation Discussion and Analysis above, provides cash severance benefits to participants upon a termination without cause or due to death, disability or retirement. The Senior Executive Severance Policy covers a group of senior level employees, including Messrs. Lee, Westfall and Ms. Dallob.Witzeman. Messrs. McNamara and Williams are not covered by this policy.
For a termination without cause, each of Messrs. Lee, Westfall and Ms. DallobWitzeman would be entitled to a lump-sum payment equal to one and a half times his or her then-current base salary plus a pro-rated portion of his or her average annual incentive compensation for the then-past three full fiscal years. Messrs. Lee, Westfall and Ms. DallobWitzeman would also be entitled to continue to participate in the Company’s welfare benefit plans for one year following termination of employment at the then-current rate of contribution. The definition of “cause” under the Senior Executive Severance Policy is identical to the definition of cause under the employment agreements described above.
For a termination due to death, disability or retirement, each of Messrs. Lee, Westfall and Ms. DallobWitzeman would be entitled to a lump-sum payment equal to the pro-rated portion of the average of his or her annual incentive compensation for the then-past three full fiscal years.
If the payments set forth above were subject to the excise taxes imposed by Section 409A of the Code, Messrs. Lee, Westfall and Ms. Dallob,Witzeman, but not any personnel added as plan participants after August 2018, would be entitled to a gross-up payment. For purposes of the quantification of possible payments due to Messrs. Lee, Westfall and Ms. DallobWitzeman upon termination under the Senior Executive Severance Policy in each of the scenarios set forth in the table above, it is assumed that no excise taxes pursuant to Section 409A of the Code would be imposed. As such, the amounts in the table under the heading “Summary of Payouts Under Contract/Severance/Control Agreements” do not reflect a gross-up payment with respect to any such excise tax pursuant to Section 409A of the Code.
Severance payments and benefits under the Senior Executive Severance Policy are conditioned upon execution of a general release of claims in favor of the Company. Additionally, for a termination without cause or due to disability or retirement, such severance payments and benefits are conditioned upon nondisclosure and one-year non-compete and non-solicitation covenants.
40
Equity Compensation Plans
Pursuant to the Stock Incentive Plans, all restricted stock awards vest upon the holder’s termination of employment due to death, disability or termination without cause. Upon the holder’s retirement, the restrictions will lapse as to a fraction of the restricted stock equal to the length of time, in years, from the date such awards were granted to the date of the holder’s retirement over the total number of years over which the award would have vested. Performanceperformance share units are forfeited on termination of employment prior to their settlement dates, unless termination is upon death, disability or retirement, then they vest pro rata. Vested stock option awards granted under the Stock Incentive Plans remain exercisable for three months following termination of the holder’s employment, if the Compensation Committee so specifically consents, except for termination due to death, incapacity or retirement, in which case vested stock option awards remain exercisable for 15 months following termination and unvested options continue to vest for 3 months upon retirement. For a description of the treatment of outstanding unvested stock option awards and performance share units and restricted stock awards upon a change in control of the Company, see the narrative under the heading “Potential Payment to Executives Upon Termination or Change in Control -- Change in Control of the Company” preceding.
Change in Control of the Company
Change in Control Plan
The Change in Control Plan, described in additional detail in the Compensation Discussion and Analysis, covers 20 officers of the Company, including the named executive officers. However, in the event of a change in control of the Company, Messrs. McNamara and Williams would not receive benefits under both their employment agreements and the Change in Control Plan, and the participants in the Senior Executive Severance Policy would not receive benefits under both the Senior Executive Severance Policy and the Change in Control Plan.
Under the Change in Control Plan, a change in control of the Company means, in general, the occurrence of any one of the following events: (a) certain acquisitions by a third party of at least 30% of the then-outstanding Capital Stock; (b) individuals who constituted the Board of Directors when the plan became effective (the “Incumbent Board”) cease to constitute at least a majority of the Board (provided that the Incumbent Board will be deemed to include any director (other than one elected in certain contested solicitations) whose election, or nomination by the stockholders for election, to the Board was approved by a majority of the Board members then comprising the Incumbent Board); (c) consummation of certain mergers, consolidations and similar transactions involving the Company unless the Company is the surviving entity and no person holds 30% or more of the then-outstanding Capital Stock (except to the extent such ownership existed prior to the transaction) and individuals who were members of the Incumbent Board constitute at least a majority of the Board following such transaction; (d) approval by the Company’s stockholders of a plan for the complete liquidation or dissolution of the Company or the sale of all or substantially all of the Company’s assets; or (e) any other transaction that the Compensation Committee or such other committee as determined by the Board deems to be a change in control.
The Change in Control Plan provides for severance payments and benefits in the event of a change in control of the Company followed within two years by an executive’s termination of employment either without cause or for good reason (“double trigger”). Payments under the Change in Control Plan are triggered by (a) termination of employment by the Company without cause or (b) termination of employment by the employee within 90 days of an event giving him or her good reason to so terminate (such termination without cause or for good reason, a “Qualifying Termination”). The definition of cause is identical to the definition of cause in the employment agreements discussed above. Good reason consists of a material reduction in the nature and scope of the participant’s responsibilities, authority or duties; a reduction in the participant’s base salary below the participant’s highest base salary during the 120-day period prior to or any time following a change in control, annual incentive compensation below the participant’s average annual incentive compensation for the then-past three full fiscal years prior to the change in control, equity-based compensation below that received during the 120-day period prior to the change in control or in the aggregate level of employee benefits; a relocation of the participant’s principal work location by more than 50 miles; or notice of the Company’s intention to cancel or not renew his employment agreement.
Upon a Qualifying Termination, Messrs. McNamara and Williams would receive a payment equal to three times, and Messrs. Lee, Westfall and Ms. DallobWitzeman would receive a payment equal to two times, the sum of (a) such named executive officer’s highest base salary during the 120-day period prior to or any time following the change in control and (b) the average of such named executive officer’s annual incentive compensation for the then-past three full fiscal years prior to the change in control, all paid in cash in a lump-sum within 10 days following termination. If the Qualifying Termination were to take place in a fiscal year other than the fiscal year during which the change in control occurred, each named executive officer would also receive a pro-rated portion of his three-year average annual incentive compensation.
41
Upon a Qualifying Termination, participants would also be entitled to receive benefits under the Company’s welfare benefit plans and perquisites for a period of three years (for Messrs. McNamara and Williams) or two years (for Messrs. Lee, Westfall and Ms. Dallob)Witzeman), and outplacement assistance up to $25,000. Such perquisites would be provided at a level comparable to the level of perquisites received immediately prior to the Qualifying Termination or the change in control, whichever would be more favorable to the participant. If the employee becomes re-employed during the applicable two-year or three-year period and is eligible to receive comparable benefits from his new employer, the benefits provided by the Company under its welfare benefit plans are secondary to those provided by the new employer.
Within 10 days of a Qualifying Termination, a participant would also be entitled to receive a lump-sum cash payment in the amount of employer contributions to the participant’s account in the Company’s qualified and non-qualified defined contribution plans, assuming the participant’s participation in the plans had continued on the same basis as immediately prior to the termination for the applicable three-year period (for Messrs. McNamara and Williams) or two-year period (for Messrs. Lee, Westfall and Ms. Dallob)Witzeman).
Regardless of whether a participant is terminated and in addition to the severance benefits set forth above, upon a change in control, each participant in the Change in Control Plan would receive, within 10 days following the change in control, a lump-sum payment equal to the average of the participant’s annual incentive compensation for the then-past three full fiscal years. The payments described in this paragraph are referred to as “single-trigger” payments.
All payments under the Change in Control Plan are conditioned on execution of a general release of claims in favor of the Company. If payments under the Change in Control Plan were subject to taxes imposed by Sections 4999 or 409A of the Code, certain participants would be entitled to a gross-up payment. For purposes of the quantification of possible payments due to the named executive officers pursuant to the Change in Control Plan, it is assumed that no excise tax pursuant to Section 409A of the Code would be imposed. Following amendment of this plan in August 2018, newly added participants are not eligible for such payments. As such, the amounts in the table under the heading “Qualifying Termination following or in connection with a Change in Control” do not reflect a gross-up payment with respect to any excise taxes pursuant to Section 409A of the Code. The amount of gross-up payments to which the named executive officers would be entitled with respect to tax imposed by Section 4999 of the Code are set forth in the table above, under the heading “Qualifying Termination following or in connection with a Change in Control”, and the assumptions used in determining the amounts are set forth in footnote (f) of such table.
Equity Compensation Plans
Pursuant to the Stock Incentive Plans, upon a change in control of the Company, all outstanding unvested stock options granted prior to 2013 and restricted stock awards would become fully vested. For stock options granted in 2013 and thereafter and for performance share units, a ”double trigger” of employment termination without cause or for good reason is required for vesting. Under the Stock Incentive Plans, a change in control of the Company means, in general, the occurrence of any one of the following events: (a) certain acquisitions by a third party of at least 30% of the then-outstanding Capital Stock; (b) the expiration of a tender offer or exchange offer (other than an offer by the Company) pursuant to which 20% or more of the shares of Capital Stock have been purchased; (c) merger or consolidation in which the Company is not the surviving corporation, a plan for the liquidation of the Company or an agreement for the sale or other disposition of all or substantially all of the Company’s assets; or (d) during any period of two consecutive years, individuals who constitute the Board of Directors at the beginning of such period cease to constitute at least a majority of the Board (provided that the Board at the beginning of such period shall be deemed to include any director whose nomination for election was approved by at least one-half of the persons who were directors (or deemed to be directors) at the beginning of the two-year period).
Deferred Compensation Plans
Upon a termination for any reason, each of Messrs. McNamara, Williams, Westfall and Ms. DallobWitzeman would be entitled to the aggregate balance in his or her account in the Excess Benefit Plan, and Mr. Lee would be entitled to the aggregate balance in his account in the Deferred Compensation Plan. Each of the participating named executive officers would also be entitled to the aggregate balance in his account in the Supplemental Pension Plan. The aggregate balances in these accounts for each named executive officer are set forth in the Non-Qualified Deferred Compensation Table above.
42
Executive Pay Ratio
The compensation of our Chief Executive Officer in 20182021 was approximately 208218 times the median pay of our full-time, seasonal, and part-time employees.
We identified the median employee by including all W-2 employees as of December 31, 2018.2021 who had received W-2 wages during the calendar year. Of the 15,68314,033 total employees of Chemed and its subsidiaries meeting the above criteria during 2018, 3,1442021, 2,247 were part-time or seasonal.
We annualized such earnings for full-time employees who started work on or after January 1, 2018.2021. We then used the Box 1, W-2 data to identify the median employee.
For computing the ratio, we calculated such employee’s total annual compensation, including:
| a. | Salary or hourly pay, as applicable |
| b. | Overtime or premium pay, if applicable |
| c. | Bonuses and commissions, if applicable |
| d. | Company contributions to 401K plans, and |
| e. | Company cost of term life insurance |
We calculated the reasonable estimate pay ratio by comparing our Chief Executive Officer’s compensation pursuant to Item 402(c)(2)(x), as detailed in the Summary Compensation Table. We divided this by the median employee’s total annual compensation. The ratio is $8,778,637$11,659,622 divided by $42,115$53,365.25 = 208218 to 1.
TRANSACTIONS WITH RELATED PERSONS
Ms. Laney receives $20,000$24,000 per year as chairperson of the Chemed Foundation, a charitable organization affiliated with the Company.
A son of Kevin J.Mr. McNamara, the Company’s Chief Executive Officer, began employment with Chemed in November of 2018, after previously serving as Director of Innovation and Development at VITAS.Vitas. His compensation in 2018 was $179,797, which includes salary for 2018,2021 plus his bonus for 2021 paid in 2019 for 2018.2022 was $426,162. He also received stock options commensurate with his level of responsibilities. His compensation package was established by the Company in accordance with our employment and compensation practices applicable to employees with equivalent qualifications and responsibilities and holding similar positions.
43
SECURITY OWNERSHIP OF CERTAIN
BENEFICIAL OWNERS AND MANAGEMENT
BENEFICIAL OWNERS AND MANAGEMENT
This table sets forth information as of December 31, 2018,2021, with respect to the only persons known to us to beneficially own more than 5% of the outstanding Capital Stock:
Name and Address Of Beneficial Owner | Amount and Nature of Beneficial Ownership | Percent of Class (a) |
The Vanguard Group 100 Vanguard Boulevard Malvern, PA 19355 BlackRock, Inc. 55 E. 52nd Street New York, NY 10055 |
(a) For purposes of calculating Percent of Class, all shares of Capital Stock subject to stock option awards which | |
were exercisable within 60 days of December 31, 2021, were assumed to have been issued.
(b) Sole voting power, 0 shares; shared voting power, 8,308 shares; sole dispositive power, 1,718,755 shares;
shared dispositive power, 21,691 shares.
(c) Information is based on a Schedule 13G filed with the SEC on February 9, 2022.
(d) Sole voting power, 1,285,059 shares; sole dispositive power, 1,343,981 shares.
(e) Information is based on a Schedule 13G filed with the SEC on January 31, 2022.
This table shows the shares of Capital Stock beneficially owned by all nominees and directors of the Company, the current executive officers named in the Summary Compensation Table, the Company’s directors and executive officers, and the Chemed Foundation as a group as of December 31, 2018:2021:
(table on next page)
44
CAPITAL STOCK
(Number of shares/options)
Owner | Amount and Nature of Beneficial Ownership | ||||
Direct and Thrift Plan (a) | Options Exercisable (b) | Trusteeships and Family Holdings (c) | Total | Percent of Class (d) | |
Kevin J. McNamara | 122,550 | 107,265 | - | 229,815 | 1.39% |
| Naomi C. Dallob | 3,645 | - | - | 3,645 | - |
Joel F. Gemunder | 21,699 | - | - | 21,699 | - |
Patrick P. Grace | 4,520 | - | - | 4,520 | - |
Thomas C. Hutton | 40,326 | 10,100 | 49,216 | 99,642 | - |
Walter L. Krebs | 11,971 | - | - | 11,971 | - |
Spencer S. Lee | 30,504 | 25,066 | - | 55,570 | - |
Andrea R. Lindell | 7,240 | - | - | 7,240 | - |
Thomas P. Rice | 7,223 | - | - | 7,223 | - |
Donald E. Saunders | 8,251 | - | - | 8,251 | - |
George J Walsh III | 8,716 | - | - | 8,716 | - |
| Nicholas M. Westfall | 4,052 | 18,533 | - | 22,585 | - |
Frank E. Wood | 10,623 | - | - | 10,623 | - |
David P. Williams | 24,918 | 59,432 | - | 84,350 | - |
Chemed Foundation | - | - | 80,996 | 80,996 | - |
Total as a group | 306,238 | 220,396 | 130,212 | 656,846 | 3.96% |
| Amount and Nature of Beneficial Ownership | ||||||||||||||||||||
| Trusteeships | ||||||||||||||||||||
| Direct and | Options | and Family | Percent of | |||||||||||||||||
| Owner | Thrift Plan (a) | Exercisable (b) | Holdings (c ) | Total | Class (d) | |||||||||||||||
Kevin J. McNamara | 129,507 | 72,874 | - | 202,381 | 1.31 | % | ||||||||||||||
Ron DeLyons | 549 | - | - | 549 | - | |||||||||||||||
Joel F. Gemunder | 22,505 | - | - | 22,505 | - | |||||||||||||||
Patrick P. Grace | 3,270 | - | - | 3,270 | - | |||||||||||||||
Christopher J. Heaney | 1,272 | - | - | 1,272 | - | |||||||||||||||
Thomas C. Hutton | 40,859 | 3,938 | 45,216 | 90,013 | - | |||||||||||||||
Brian Judkins | 62 | 5,927 | - | 5,989 | - | |||||||||||||||
Spencer S. Lee | 25,182 | 30,339 | - | 55,521 | - | |||||||||||||||
Andrea R. Lindell | 5,716 | - | - | 5,716 | - | |||||||||||||||
Thomas P. Rice | 5,188 | - | - | 5,188 | - | |||||||||||||||
Donald E. Saunders | 5,696 | - | - | 5,696 | - | |||||||||||||||
George J Walsh III | 2,802 | - | - | 2,802 | - | |||||||||||||||
Nicholas M. Westfall | 7,478 | 27,944 | - | 35,422 | - | |||||||||||||||
David P. Williams | 27,530 | 75,171 | - | 102,701 | - | |||||||||||||||
Michael D. Witzeman | 1,855 | 14,215 | - | 16,070 | - | |||||||||||||||
Chemed Foundation | - | - | 70,611 | 70,611 | - | |||||||||||||||
Total as a group | 279,471 | 230,408 | 115,827 | 625,706 | 4.03 | % | ||||||||||||||
(a) Such securities include shares of Capital Stock allocated as of December 31, 2021, to the account of each named person or member of the group under the Retirement Plan or, with respect to Mr. Gemunder, allocated to his account as of December 31, 2016, under the Omnicare Employees’ Savings and Investment Plan (the “Omnicare Savings Plan”). No such shares are pledged.
(b) “Option” refers to shares of Capital Stock which the named person or group has a right to acquire within 60 days from December 31, 2021. Except as otherwise disclosed in this Proxy Statement, each director, director nominee and executive officer has sole voting and investment power over the shares of Capital Stock shown as beneficially owned.
45
| (c) | Mr. Hutton is a trustee of several trusts and private foundations which hold in the aggregate, 49,216 shares of Capital Stock over which the trustee has shared voting and investment power. Messrs. McNamara and Hutton and Ms. Laney are trustees of the Chemed Foundation, which holds |
| (d) | Percent of Class includes Direct, Option and Trustee shares where indicated. For purposes of determining the Percent of Class, all shares of Capital Stock subject to stock option awards which were exercisable within 60 days from December 31, |
Delinquent Section 16(a) Beneficial Ownership Reporting ComplianceReports
During 2018,2021, all reports for the Company’s executive officers, directors and beneficial owners of more than 10% of the outstanding shares of Capital Stock required to be filed under Section 16(a) of the Securities Exchange Act of 1934 were filed on a timely basis, with the exception of: (i)provided that a Form 4 for Mr. Westfall who filed an amended Form 4 50 dayswas published one day late due to report one additionaltechnical issues, reporting a sale of Capital Stock totaling $3,717,659, and (ii) Mr. Saunders, who filed three Form 4s late to report sales of Capital Stock totaling $117,485 (in two transactions, 16 days late), $95,766 (in two transactions, one day late), and $92,622 (in a single transaction, two days late), respectively.$695,033.
Clawback Policy
The Compensation Committee will review all performance-based compensation awarded to or earned by officers subject to Section 16(b) of the Securities Exchange Act of 1934 during the three-year period prior to any restatement of the Company’s financial results, if the Compensation Committee determines such officer engaged in intentional or unlawful misconduct which materially contributed to the need for such restatement. If the Compensation Committee determines the amount of such performance-based compensation would have been lower if calculated on the restated financials, the Compensation Committee may seek to recover the excess amount.
Anti-Hedging Policy
The Company does not permit its officers or directors to indirectly or directly hedge any shares of Capital Stock. Additionally, the Company’s Policy on Business Ethics, applicable to all employees, identifies trading in the Company’s securities for quick profits or speculation as an impermissible conflict of interest and further discourages any short-term trading, as such trading creates pressures inconsistent with the required impartial exercise of judgment on the Company’s behalf.
PROPOSAL TO APPROVE AND ADOPT THE
2022 STOCK INCENTIVE PLAN
In view of the limited remaining shares available for the grant of additional stock awards, performance share units or stock options under the previously adopted Stock Incentive Plans, the Compensation Committee has approved, subject to stockholder approval, the adoption of the 2022 Incentive Plan (the “2022 Stock Incentive Plan”) pursuant to which 1,000,000 shares of Capital Stock may be issued or transferred to key employees as stock incentives. This is approximately 6.7% of the total 14,912,532 outstanding shares of Capital Stock as of December 31, 2021. The full text of the proposed 2022 Stock Incentive Plan is set forth as Exhibit A to this Proxy Statement. The following discussion is qualified in its entirety by reference to such text.
46
KEY HIGHLIGHTS OF THE INCENTIVE PLAN
| Plan Administrator | The Compensation Committee |
| Award Types | Non-qualified stock options, restricted stock, performance share units, or other types of stock-based awards, or any combination of these, as the Committee may determine |
| Effective Date | May 16, 2022 (subject to stockholder approval) |
| Term | Ten years (subject to earlier termination by the Board) |
| Eligible for Awards | All employees of the Company or its subsidiaries who, in the opinion of the Committee, can contribute significantly to the growth and successful operations of the Company or a subsidiary. Non-employee directors and officers of the Company and its subsidiaries are also eligible for awards |
| Future Benefits Not Presently Determinable | Awards may be granted by the Committee in its discretion and, therefore, future benefits to be allocated to any individual or group of individuals under the 2022 Stock Incentive Plan are not presently determinable |
Best Practices
| ✔ | 3-year vesting applicable to time-based awards; all but 50,000 shares will not vest in less than one year |
| ✔ | limited number of shares authorized |
| ✔ | double-trigger change of control vesting of awards – if awards are assumed or replaced with substantially equivalent awards, they will not automatically vest and pay out solely as a result of a change of control |
| ✔ | no discounted stock options or rights |
| ✔ | no re-pricing of stock options or rights |
| ✔ | no provision for an underwater cash buy-out |
| ✔ | no payment of dividends on unvested performance shares |
THE 2022 STOCK INCENTIVE PLAN
The 2022 Stock Incentive Plan will become effective as of the date it is adopted by the stockholders of the Company, i.e., May 16, 2022. If it is not adopted by the stockholders, the 2022 Stock Incentive Plan will be of no force and effect. If it is adopted, no incentives may be granted under the 2022 Stock Incentive Plan after May 16, 2032. The Board of Directors may terminate the 2022 Stock Incentive Plan at any earlier time, but outstanding options will continue to be exercisable until they expire in accordance with their terms. The market value of the Capital Stock as of March 23, 2022 was $481.50 per share.
The 2022 Stock Incentive Plan authorizes the issuance or transfer of a maximum of 1,000,000 shares of Capital Stock pursuant to stock incentives granted to key employees of the Company and its subsidiaries under the 2022 Stock Incentive Plan. “Key employees” are employees of the Company or a subsidiary, including officers and directors thereof, who, in the opinion of the Compensation Committee, are deemed to have the capacity to contribute significantly to the growth and successful operations of the Company or a subsidiary.
Stock incentives granted under the 2022 Stock Incentive Plan may be in the form of options to purchase Capital Stock (“stock options”), restricted awards of Capital Stock in payment of incentive compensation (“stock awards”); performance share units (“PSUs”); or other stock-based awards denominated in whole or in part by reference to Capital Stock. However, no non-employee director shall be granted awards valued at more than $500,000 during any calendar year under this Plan.
47
Stock Awards Under the 2022 Stock Incentive Plan, a stock incentive in the form of a stock award will consist of shares of Capital Stock issued as incentive compensation earned or to be earned by the employees. Shares subject to a stock award may be issued when the award is granted or at a later date, with or without dividend equivalent rights. A stock award shall be subject to such terms, conditions and restrictions (including restrictions on the transfer of the shares issued pursuant to the award) as the Compensation Committee shall designate, with a minimum vesting period of three years, and no portion of any stock award vesting in less than one year, provided that Awards covering up to 50,000 shares of Capital Stock are exempted from these vesting requirements under the 2022 Stock Incentive Plan.
Stock Options Under the 2022 Stock Incentive Plan, a stock incentive in the form of a stock option will provide for the purchase of shares of Capital Stock in the future at an option price per share not less than 100 percent of the fair market value of the shares on the date of grant, as defined in the Plan. Each option shall be exercisable in full or in part one year after the date the option is granted, or may become exercisable in one or more installments and at such time or times, as the Compensation Committee shall determine, or upon various circumstances which may result in a change of control. Unless otherwise provided in the option, an option, to the extent it is or becomes exercisable, may be exercised at any time in whole or in part until the expiration or termination of the option. Any provision in any outstanding option specifying when the option may be exercisable or that it be exercisable in installments may be modified at any time during the life of the option by the Compensation Committee. No such modification of an outstanding option shall, without the consent of the optionee, adversely affect any option granted to him. No dividends are payable on options.
Under the exercise of an option, the purchase price shall be paid in cash or, if so provided in the option, in shares of Capital Stock or in a combination of cash and such shares. The Company may cancel all or a portion of an option subject to exercise and pay the holder cash or shares equal to the excess of the fair market value of such cancelled shares over their option price. Options shall be granted for such lawful consideration as the Compensation Committee shall determine.
All stock options granted under the 2022 Stock Incentive Plan will expire within ten years from the date of grant. A stock option is not transferable or assignable by an optionee other than by will, by the laws of descent and distribution, pursuant to a qualified domestic relations order or to certain family members, if permitted under SEC Rule 16b-3 or any successor rule thereto, and each option is exercisable, during his lifetime, only by him or a permitted transferee or assignee. Unexercised options terminate upon termination of employment, except that if termination arises from a resignation with the consent of the Compensation Committee, by reason of his death while employed, retirement or incapacity, or death, the options will no longer vest after three months from such event and the options will terminate fifteen months after such event. A leave of absence for military or governmental service or for other purposes, if approved by the Compensation Committee, is not a termination of employment, but no options are exercisable during any such leave.
Exercise of a stock option will be conditioned on an optionee’s payment in full of the purchase price for the shares, in cash or by the transfer to the Company of shares of Capital Stock at fair market value on the date of transfer. An optionee shall not be considered a holder of the shares subject to a stock option until actual delivery of a certificate representing such shares is made by the Company.
None of the stock options granted under the 2022 Stock Incentive Plan will be “restricted,” “qualified” or “incentive” stock options or options granted pursuant to an “employee stock purchase plan” as the quoted terms are defined in Sections 422 through 424 of the Code.
Performance Share Units Under the 2022 Stock Incentive Plan, the Committee may grant PSUs whose issuance, transfer or retention is contingent on attainment of specified objectives as established by the Committee. Performance goals may be measured solely on a Company, subsidiary or business unit basis, or a combination thereof. Performance criteria may be measured on an absolute or cumulative basis or on a basis of percentage of improvement over time, and may be measured relative to selected peer companies or a market index. The Committee may also grant other stock-based awards under this Plan. The grant of such awards shall be on such terms and conditions as specified by the Committee.
With respect to vesting of PSU awards by conversion into shares of Capital Stock, the employee must recognize ordinary income equal to the cash or the fair market value of the shares of Capital Stock and the Company will be entitled to a deduction for the same amount. With respect to stock awards, the employee must recognize ordinary income equal to the fair market value of the shares of Capital Stock at the first time such shares become transferable or not subject to a substantial risk of forfeiture, and the Company will be entitled to a deduction for the same amount.
48
Federal Income Tax Consequences Related to Options and PSUs An optionee realizes no taxable income by reason of the grant of a nonstatutory option or a nonvested PSU. Subject to insider trading restrictions, upon exercise of the option an optionee realizes compensation taxable as ordinary income in the amount of the excess of the fair market value of the shares of Capital Stock over the option price on the date of exercise. Upon the sale of shares of Capital Stock acquired pursuant to the exercise of an option, an optionee realizes either a capital gain or a capital loss based upon the differences between his or her selling price and the fair market value of such shares on the date of exercise. Such capital gain or loss will be either short-term or long-term depending on the period elapsed between the date of exercise and the date of sale. When the employee receives compensation taxable as ordinary income, the Company or a subsidiary will generally be entitled to a Federal income tax deduction in the amount of such compensation. An employee will not recognize a gain on previously owned shares of Capital Stock if he exercises an option and transfers such shares to the Company in payment of the option price. Taxes payable by an optionee or awardee on exercise of an option, realization of an award upon vesting of a PSU or removal of restrictions on an award may be paid in cash, by surrender of shares, or by withholding of shares of Capital Stock as the Compensation Committee shall determine.
The Board of Directors, upon the recommendation of the Compensation Committee, may amend the 2022 Stock Incentive Plan subject, in the case of specified amendments, to stockholder approval. The 2022 Stock Incentive Plan may be discontinued at any time by the Board of Directors. No amendment or discontinuance of the 2022 Stock Incentive Plan shall, without the consent of the employee, adversely affect any stock incentive held by him under the 2022 Stock Incentive Plan. No outstanding awards under the 2022 Stock Incentive Plan will be priced lower than originally issued without stockholder approval, except in the case of certain corporate transactions.
No determination has been made with respect to any prospective grant of a stock incentive under the 2022 Stock Incentive Plan for any of the Company’s executive officers or directors. It is, therefore, not possible at the present time to indicate specifically the names of the executive officers or directors to whom stock incentives may be granted or to whom stock incentives would have been granted had this Plan been in effect during 2021, or the number of shares to be subject to stock incentives or any other information concerning the operation of the 2022 Stock Incentive Plan as it may affect these specific individuals. The proceeds of sale of shares of Capital Stock under the 2022 Stock Incentive Plan will be used by the Company for general corporate purposes.
BURN RATE AND OVERHANG
As of December 31, 2021, the Company had 14,912,532 shares of Capital Stock issued and outstanding and 535,501 shares of Capital Stock available for future equity awards. In setting and recommending to stockholders the number of shares to be authorized under the 2022 Incentive Stock Plan, the Committee reviewed statistics analyzing the Company’s use of equity for long term awards and its impact. In particular, the Committee reviewed the Company’s historical 3-year average burn rate (shares used for equity awards as a percentage of the total shares outstanding) and the Company’s overhang (as described below).
As of December 31, 2021, the number of stock options outstanding under the Company’s equity compensation plans, the weighted average exercise price of outstanding options, and the number of securities remaining available for issuance were as follows:
49
Plan Category | Number of Securities to be Issued Upon Exercise of Outstanding Options, Warrants and Rights | Weighted- Average Exercise Price of Outstanding Options, Warrants and Rights | Number of Securities Remaining Available for Future Issuance Under Equity Compensation Plans (Excluding Securities Reflected in First Column) |
Equity Compensation Plans Approved by Stockholders: 2018 Stock Incentive Plan 2015 Stock Incentive Plan 2010 Stock Incentive Plan Total (a)(b) | 697,884 337,767 118,386 1,154,037 | $ 452.57 332.97 207.87 $ 392.46 | 525,797 9,704 - 535,501 |
(a) As of December 31, 2021, the weighted average remaining term of the outstanding stock options is 3.4 years.
(b) There are no unvested stock awards outstanding and the number of PSUs outstanding is 35,834. These figures are not included in the 1,154,037 total.
As of December 31, 2021, the burn rate calculation is as follows:
Options Granted | Full-Value Shares Granted(a) | Total Granted | Weighted Average Number of Capital Shares Outstanding | Burn Rate(b) | |
| 2021 | 326,806 | 14,984 | 341,790 | 15,671,000 | 2.18% |
| 2020 | 298,670 | 12,823 | 311,493 | 15,955,000 | 1.95% |
| 2019 | 287,010 | 16,371 | 303,381 | 15,969,000 | 1.90% |
| 3-year average burn rate | 2.01% | ||||
(a) Includes PSUs.
(b) Burn rate calculated as Total Granted divided by Weighted Average Capital Shares Outstanding.
These numbers do not take into account shares forfeited or cancelled.
50
Finally, the Committee considered the dilutive effect of the proposed share authorization (including existing outstanding and potential future awards), or “overhang”, calculated as summarized below. Overhang was calculated as of December 31, 2021 on a fully diluted basis as follows:
Total Equity Based Awards Outstanding | + | Shares Available for Future Issuance | ÷ | Total Number of Issued and Outstanding Shares of Capital Stock | + | Total Equity Based Awards Outstanding | + | Shares Available for Future Issuance | = | Overhang |
1,189,871 | 535,501 | 14,912,532 | 1,189,871 | 535,501 | 10.4% |
Given the size of the share request relative to the statistics that it reviewed, the Committee recommended to the Board approval of a request for 1,000,000 shares.
In order to effect the approval and adoption of the 2022 Stock Incentive Plan, the following resolution will be presented to the Annual Meeting:
“RESOLVED, that the 2022 Stock Incentive Plan set forth as Exhibit A to the Proxy Statement accompanying the Notice of the Annual Meeting of the Stockholders of Chemed Corporation to be held May 16, 2022, be and the same hereby is approved and adopted.”
The affirmative vote of the majority of the shares represented at the meeting and entitled to vote will be necessary for the adoption of the foregoing resolution, with abstentions having the effect of negative votes and broker non-votes having no effect because they are not considered entitled to vote on this matter. The approval and adoption of the 2022 Stock Incentive Plan is required to be submitted to a vote of the stockholders of the Company by the listing standards of the New York Stock Exchange. We are also submitting this proposal to a vote of stockholders so that the Company may use the shares authorized under the 2022 Stock Incentive Plan to assist it in achieving its goals of increasing profitability, increasing shareholder value, and aligning employees’ interests with those of shareholders, while also seeking a federal income tax deduction for certain compensation paid under the 2022 Stock Incentive Plan. The 2022 Stock Incentive Plan will become effective upon adoption by the stockholders.
The Board of Directors recommends a vote FOR the approval and adoption of the 2022 Stock Incentive Plan.
RATIFICATION OF SELECTION OF INDEPENDENT REGISTERED PUBLIC ACCOUNTANTS
The Audit Committee has selected the firm of PricewaterhouseCoopers LLP as independent accountants for the Company and its consolidated subsidiaries for 2019.2022. This firm has acted as independent accountants for the Company and its consolidated subsidiaries since 1971. This long-term relationship benefits the Company through the accounting firm’s substantial working knowledge of the Company and its operations. Although the submission of this matter to the stockholders is not required by law or by the bylaws of the Company, the selection of PricewaterhouseCoopers LLP will be submitted for ratification at the Annual Meeting. The affirmative vote of the majority of the shares represented at the meeting, with abstentions having the effect of negative votes, will be necessary to ratify the selection of PricewaterhouseCoopers LLP as independent accountants for the Company and its consolidated subsidiaries for 2019.2022. Representatives of PricewaterhouseCoopers LLP are expected to be present at the Annual Meeting, will have the opportunity to make a statement if they so desire and are expected to be available to respond to appropriate questions. The Board unanimously recommends that you vote FOR the ratification of the Audit Committee’s selection of independent accountants. If the selection is not ratified at the meeting, the Audit Committee will reconsider its selection of independent accountants.
AUDIT COMMITTEE REPORT
The Audit Committee is appointed by the Board of Directors to assist the Board in monitoring:
| ● | The integrity of the Company’s financial statements. |
| ● | Compliance by the Company with legal and regulatory requirements. |
| ● | The independence and performance of the Company’s internal and external auditors. |
During 2000, the Audit Committee developed a charter for the Committee, which was approved by the full Board of Directors on May 15, 2000. The charter was most recently amended on July 23, 2015. A copy of the charter is available on the Company’s Web site,website, www.chemed.com.
The Company’s management has primary responsibility for preparing the Company’s financial statements and for the Company’s financial reporting process. The Company’s independent accountants, PricewaterhouseCoopers LLP, are responsible for expressing an opinion on the conformity of the Company’s audited financial statements to generally accepted accounting principles.
In this context, the Audit Committee hereby reports as follows:
| 1. | The Audit Committee has reviewed and discussed the audited financial statements and management’s report on internal control over financial reporting with the Company’s management. |
| 2. | The Audit Committee has discussed with the independent accountants the |
| 3. | The Audit Committee has received the written disclosures and the letter from the independent accountants required by the applicable requirements of the Public Company Accounting Oversight Board regarding the independent accountants’ communications with the Audit Committee concerning independence and has discussed with the independent accountants the independent accountants’ independence. |
| 4. | Based on the review and discussion referred to in paragraphs (1) through (3) above, the Audit Committee recommended to the Board of Directors that the audited financial statements be included in the Company’s Annual Report on Form 10-K for the fiscal year ended December 31, |
Each of the members of the Audit Committee is independent as defined under the listing standards of the New York Stock Exchange.
The undersigned members of the Audit Committee have submitted this Report.
Patrick P. Grace, Chairman
Ron DeLyons
Thomas P. Rice
Donald E. Saunders
FEES PAID TO INDEPENDENT REGISTERED PUBLIC ACCOUNTANTS
Audit Fees
PricewaterhouseCoopers LLP billed the Company $2,091,000$2,165,000 for 20172020 and $2,205,000$2,260,000 for 2018.2021. The fees and related expenses were for professional services rendered for the integrated audit of the Company’s annual financial statements and of its internal controls over financial reporting, review of the financial statements included in the Company’s Forms 10-Q and review of documents filed with the SEC.
Audit-Related Fees
PricewaterhouseCoopers LLP billed the Company $137,000$150,000 and $141,000$171,000 for 20172020 and 2018,2021, respectively, for audit-related services. These services were related primarily to the audit of one of Vitas’ Florida subsidiaries.
Tax Fees
No such services were rendered during 20172020 or 2018.2021.
All Other Fees
No such services were rendered during 20172020 or 2018.2021.
The Audit Committee has adopted a policy which requires the Committee’s pre-approval of audit and non-audit services performed by the independent auditor to assure that the provision of such services does not impair the auditor’s independence. The Audit Committee pre-approved all of the audit and non-audit services rendered by PricewaterhouseCoopers LLP as listed above.
ADVISORY VOTE TO APPROVE EXECUTIVE COMPENSATION
The Board is submitting this Say On Pay proposal pursuant to Section 14A of the Securities Exchange Act of 1934, which allows our stockholders to cast a non-binding vote to approve the compensation of our named executive officers as disclosed in the Compensation Discussion and Analysis and accompanying compensation tables in this Proxy Statement.
In deciding how to vote on this proposal, the Board urges you to carefully consider the actions taken related to the Company’s executive compensation practices in response to stockholder input, more fully described in the Compensation Discussion and Analysis. We encourage stockholders to review the Compensation Disclosure and Analysis above. Our creation of value over time is due to the efforts of our talented and committed executives. As discussed above in Compensation Discussion and Analysis, the Board believes that our current executive compensation program directly links executive compensation to our financial performance and aligns the interests of our executive officers with those of our stockholders. Our Board also believes that our executive compensation program provides our executive officers with a balanced compensation package that includes a reasonable base salary along with annual and long-term incentive compensation plans that are based on the Company’s financial performance. For 2018,2021, about 72.975.1 percent of our President and Chief Executive Officer’s actual total direct compensation was performance-based, while the average for the other named executive officers was about 70.273.4 percent. “Performance-based” compensation includes non equity incentive awards, restricted stock awards, option awards, and performance share units. These incentive plans are designed to reward our executive officers on both an annual and long-term basis if they attain specified target goals, the attainment of which do not require the taking of an unreasonable amount of risk, as discussed above in Compensation Risk. Our stockholders voted 95.50%95.02% in favor of executive compensation in 2018. 2021.
We believe our executive compensation program is intended to achieve the objective of aligning executives’ interests with those of stockholders. It rewards executives for long-term growth in the value of Capital Stock through encouraging them to hold a significant amount of the Company’s equity; paying for performance through both cash and equity-based incentives that, in turn, provide greater rewards for stronger performance of the Company as a whole and the Company’s business units; paying competitively in order to attract and retain senior executives; and creating incentives to maximize the long-term growth of the Company’s business. The weighting of incentive compensation toward long-term awards discourages short term risk taking. Rolling performance targets also discourage such behavior. Further, the Company’s Stock Ownership Guidelines discourage such behavior by aligning employees’ interests with those of stockholders.
The elements of the Company’s compensation program include base salary, annual cash incentive compensation and long-term incentive compensation in the forms of stock option awards and performance share units, and restricted stock awards.units. Each salary, annual cash incentive compensation and pension and welfare benefits plan amount is established by the non-employee members of the Board of Directors based upon levels that the Compensation Committee and such Board members determine are competitive and are intended to reward for current and past performance, while longer-term incentives such as stock option awards, restricted stock awards and performance share units, are intended to create incentive for future growth.
In 2011 and 2017 stockholders voted to conduct an advisory vote on executive compensation every year. The Board has adopted this frequency.
The Board endorses the Company’s executive compensation program and recommends stockholders vote in favor of the following resolution:
“RESOLVED, that compensation paid to the Company’s executive officers as disclosed pursuant to Item 402 of Regulation S-K described in this proxy statement under “Executive Compensation”, including the Compensation Discussion and Analysis, Compensation tables and narrative discussion contained in this proxy statement, is hereby APPROVED.”
Because the vote is advisory, it will not be binding upon the Board or the Compensation Committee and neither the Board nor the Compensation Committee will be required to take any action as a result of the outcome of the vote on this proposal. The Compensation Committee will carefully consider the outcome of the vote when considering future executive compensation arrangements.
The Board of Directors unanimously recommends a vote FOR the approval of the Company’s executive compensation.
STOCKHOLDER PROPOSALS
Any stockholder proposals for the 20202023 Annual Meeting of Stockholders must be in writing and received by the Secretary of the Company by December 11, 20199, 2022 to be eligible for inclusion in the Company’s proxy statement and accompanying proxy for such meeting, unless the date of the 20202023 Annual Meeting of Stockholders is changed by more than 30 days from May 20, 2020,16, 2023, in which case such proposal must be received a reasonable time before the Company begins to print and send its proxy materials for such meeting. If a stockholder intends to bring a matter before the 20202023 Annual Meeting of Stockholders other than by submitting a proposal for inclusion in the Company’s proxy materials for such meeting he or she must provide notice of the proposal to the Company’s Secretary at our principal executive offices no earlier than January 21, 2020,16, 2023, and not later than February 20, 2020,16, 2023, for such notice to be considered timely. If the date of the 20202023 meeting is advanced by more than 30 days, or delayed by more than 90 days from May 20, 2020,16, 2023, such proposal must be received not earlier than the close of business on the 120th day prior to such Annual Meeting and not later than the close of business on the later of the 90th day prior to such meeting, or, if the first public announcement of such meeting is less than 100 days prior to it, the 10th day following the day the Company made such public announcement. In the case of untimely notice of a proposal, persons named in the proxies solicited by the Company for the 20202023 Annual Meeting of Stockholders (or their substitutes) will be allowed to use their discretionary voting authority when the proposal is raised at the meeting without any discussion of the proposal in its proxy materials.
If a stockholder intends to propose a ‘proxy access’ nominee pursuant to Section 1.11 of the Company’s bylaws, he or she must provide notice of the proposal to the Company’s Secretary at the Company’s principal executive offices no earlier than November 11, 20199, 2022 and not later than December 11, 2019,9, 2022, for such notice to be considered timely. The proxy access provisions of the Company’s bylaws permit an eligible stockholder (or a group of no more than 20 eligible stockholders) owning 3% or more of the Company’s common stock continuously for at least three years to nominate director candidates representing up to two or 20% of the Board (whichever is greater), and, upon the eligible stockholder’s satisfaction of certain conditions as outlined in the Company’s bylaws, require the Company to include such nominees in the Company’s proxy statement and proxy card for the annual meeting of stockholders.
54
To comply with the universal proxy rules (once effective), stockholders who intend to solicit proxies in support of director nominees other than the Company’s nominees must provide notice that sets forth the information required by Rule 14a-19 under the Exchange Act no later than March 17, 2023.
IMPORTANT NOTICE REGARDING THE AVAILABILITY OF PROXY MATERIALS
FOR THE ANNUAL MEETING
FOR THE ANNUAL MEETING
The Proxy Statement and the Company’s 20182021 Annual Report are available on the Company’s Web sitewebsite at http://www.chemed.com.ir.chemed.com.
Information on how to obtain directions to be able to attend the meeting and vote in person are available by contacting:
Innisfree M&A Incorporated Stockholders Toll-Free: (877) 800-5194 Banks and Brokers: (212) 750-5833 |
| —or— |
| You may write to us at: |
Chemed Corporation Investor Relations Suite 2600 255 East Fifth Street Cincinnati, Ohio 45202-4726 |
The Company makes available, free of charge on its Web site,website, the Proxy Statement, Annual Report on Form 10-K, Quarterly Reports on Form 10-Q, Current Reports on Form 8-K and amendments to these reports filed or furnished pursuant to Section 13(a) or 15(d) of the Exchange Act, as soon as reasonably practicable after these documents are electronically filed with, or furnished to, the SEC. These documents are posted on the Web sitewebsite at www.chemed.com. Select the “SEC Filings” link.
A copy of the Company’s Annual Report on Form 10-K for the fiscal year ended December 31, 20182021 filed with the SEC (without exhibits) will also be made available to stockholders without charge upon written request to Chemed Investor Relations, Suite 2600, 255 East Fifth Street, Cincinnati, Ohio 45202-4726.
DUPLICATE
ANNUAL REPORT AND PROXY STATEMENT
ANNUAL REPORT AND PROXY STATEMENT
If you are a stockholder of record and share an address with another stockholder and have received only one copy of the Company’s 20182021 Annual Report or Proxy Statement, the Company undertakes to promptly deliver upon written or oral request a separate copy of these materials at no cost to you. In addition, if you are a stockholder of record and share an address with another stockholder and have received multiple copies of the Company’s 20182021 Annual Report or Proxy Statement, you may write or call the Company to request delivery of a single copy of such materials in the future. You may write to the Company at Suite 2600, 255 East Fifth Street, Cincinnati, Ohio 45202-4726, Attn: Investor Relations, or call 1-800-2CHEMED or 1-800-224-3633.
OTHER MATTERS
As of the date of this Proxy Statement, management has not been notified of any stockholder proposals intended to be raised at the Annual Meeting outside of the Company’s proxy solicitation process nor does it know of any other matters which will be presented for consideration at the Annual Meeting. However, if any other stockholder proposals or other business should come before the Annual Meeting, the persons named in the enclosed proxy (or their substitutes) will have discretionary authority to take such action as is in accordance with their best judgment.
MISCELLANEOUS
The Company will pay all solicitation expenses in connection with this Proxy Statement and related Company proxy soliciting material, including the expense of preparing, printing, assembling and mailing this Proxy Statement and any other material used in the Company’s solicitation of proxies. Proxies are being solicited through the mail. Certain executive officers and other employees of the Company, on behalf of the Company and without additional compensation, may also solicit proxies personally, by telephone, fax, email or other electronic means.
In addition, the Company has engaged Innisfree M&A Incorporated to assist it in connection with soliciting proxies for a fee estimated not to exceed $15,000, plus reasonable out-of-pocket expenses.
The Company will request banks, brokers and other custodians, nominees and fiduciaries to forward proxy soliciting material to the beneficial owners of shares held of record by such persons and obtain their voting instructions. The Company will reimburse such persons at approved rates for their expenses in connection with the foregoing activities.
Brian C. Secretary |
April 9, 20198, 2022
56
Exhibit A
Chemed Corporation
2022 Stock Incentive Plan
1.Purpose. The purpose of the Plan is to support the Company’s ongoing efforts to develop and retain excellent Key Employees and to provide them with incentives that are directly linked to the profitability of the Company’s businesses and to increases in stockholder value.
2.Definitions. For purposes of the Plan, the following terms are defined as set forth below:
a. “Award” means the grant under the Plan of Stock Options, Restricted Stock Awards, Performance Share Units, or Other Stock-Based Awards.
b. “Board” means the Board of Directors of the Company.
c. “Capital Stock” or “Stock” means the capital stock of the Company, par value $1.00 per share, or such other class of shares or other securities as may become applicable under Section 5(b).
d. “CIC Severance Plan” means the Chemed Corporation Change in Control Severance Plan.
e. “Code” means the Internal Revenue Code of 1986, as amended from time to time, and any successor thereto.
f. “Commission” means the Securities and Exchange Commission or any successor agency.
g. “Committee” means the Compensation/Incentive Committee of the Board, any successor thereto or such other committee as may be designated by the Board to administer the Plan, which, in any case, shall include as members at least two “non-employees” within the meaning of Rule 16b-3 of the SEC, two “outside directors” as defined in Section 1.162-27(e)(3) of the Treasury Regulations, and which is otherwise in compliance with any other requirements of applicable laws or regulations or the requirements of the New York Stock Exchange.
h. “Company” means Chemed Corporation, a corporation organized under the laws of the State of Delaware, or any successor thereto.
i. “Exchange Act” means the Securities Exchange Act of 1934, as amended from time to time, and any successor thereto.
j. “Fair Market Value” means, as of any given date, the mean between the highest and lowest reported sales prices of the Capital Stock on the New York Stock Exchange, or, if no such sale of Capital Stock is reported on such date, the fair market value of the Stock as determined by the Committee in good faith and in accordance with all applicable laws or regulations or the requirements of the New York Stock Exchange.
k. “Key Employee” means an employee of the Company or any of its subsidiaries who in the opinion of the Committee can contribute significantly to the growth and successful operations of the Company or its applicable subsidiary or affiliate. Directors of the Company who are not otherwise employees as such term is defined under the Code or state law are nevertheless eligible for designation as Key Employees, provided that any Awards to be granted to directors who are members of the Committee must be approved by the whole Board with such Committee member directors recusing themselves from such Board action. The grant of an Award to any person will be deemed a determination by the Committee that such person is a Key Employee for purposes of this Plan.
l. “Other Stock-Based Award” means an Award made pursuant to Section 6(a)(iv).
m. “Participant” means any eligible Key Employee as set forth in Section 4 to whom an Award is granted.
A - 1
n. “Performance Cycle” means the period selected by the Committee during which the performance of the Company or of any subsidiary, affiliate or unit thereof or any individual is measured for the purpose of determining the extent to which an Award subject to Performance Goals has been earned.
o. “Performance Goals” mean the objectives for the Company or any subsidiary or affiliate or any unit thereof or any individual that may be established by the Committee for a Performance Cycle with respect to any performance-based Awards contingently awarded under the Plan. Performance Goals may be measured on an absolute or cumulative basis or on a basis of percentage of improvement over time and may be measured relative to selected peer companies or a market index.
p. “Performance Share Unit” means an Award described in Section 6(a)(iii).
q. “Plan” means this Chemed Corporation 2022 Stock Incentive Plan, as amended from time to time.
r. “Restricted Period” means the period during which an Award may not be sold, assigned, transferred, pledged or otherwise encumbered.
s. “Restricted Stock” means an Award of shares of Capital Stock pursuant to Section 6(a)(ii).
t. “Spread Value” means, with respect to a share of Capital Stock subject to an Award, an amount equal to the excess of the Fair Market Value, on the date such value is determined, over the Award’s exercise or grant price, if any.
u. “Stock Option” means a contractual right to purchase specified shares of Capital Stock at a specified price, granted pursuant to Section 6(a)(i).
v. “Termination of Employment” means a Participant’s separation from service (as such term is defined pursuant to Code Section 409A and the regulations issued thereunder) from the Company.
3.Administration. The Plan shall be administered by the Committee, which shall have the power to interpret the Plan and to adopt such rules and guidelines for carrying out the Plan as it may deem appropriate. The Committee shall have the authority to adopt such modifications, procedures and subplans as may be necessary or desirable to comply with all applicable laws, regulations, and accounting principles. Subject to the terms of the Plan, the Committee shall have the authority to determine those Key Employees who shall receive Awards and the amount, type and terms of each Award, and to establish and administer any Performance Goals applicable to such Awards. Any determination made by the Committee in accordance with the provisions of the Plan with respect to any Award shall be made in the sole discretion of the Committee, except for Awards under Section 2(k) to members of the Committee, and all decisions made by the Committee pursuant to the provisions of the Plan shall be final and binding on all persons, including the Company and Plan Participants.
4.Eligibility. All Key Employees of the Company and its subsidiaries and affiliates are eligible to be granted Awards under the Plan.
5.Capital Stock Subject to the Plan.
a. Capital Stock Available. The total number of shares of Capital Stock reserved and available for distribution pursuant to Awards granted under the Plan shall be 1,000,000; provided, however, that any shares of Capital Stock issued to Participants pursuant to Awards in any form other than Stock Options shall be counted against such share limit as two and one-half shares for every one share of Capital Stock actually issued pursuant to such Award other than a Stock Option. Shares issued under the Plan may be either authorized but unissued shares or treasury shares, as designated by the Committee. To the extent any Award under this Plan terminates, expires or is forfeited without a distribution being made to the Participant in the form of Capital Stock, the shares subject to such Award that were not so issued, if any, shall again become available for distribution in connection with Awards under the Plan. Any shares of Capital Stock that are used by a Participant or withheld by the Company as full or partial payment of withholding or other taxes or as payment for the exercise or conversion price of an Award under the Plan shall not be available for subsequent distribution in connection with Awards under the Plan. Shares of Capital Stock repurchased by the Company using the proceeds from exercised Stock Options shall likewise not be available for subsequent distribution in connection with Awards under the Plan.
A - 2
b. Adjustments for Certain Corporate Transactions. In the event of any merger, share exchange, reorganization, consolidation, recapitalization, reclassification, distribution, stock dividend, stock split, reverse stock split, split-up, spin-off, issuance of rights or warrants or other similar transaction or event affecting the Capital Stock after adoption of the Plan, the Committee (i) shall make such adjustments or substitutions with respect to the Plan and to Awards granted hereunder as it deems appropriate to reflect the occurrence of such event, including, but not limited to, adjustments (A) to the aggregate number and kind of securities reserved for issuance under the Plan, (B) to the Award limits set forth in Section 6, (C) to the Performance Goals or Performance Cycles of any outstanding performance-based Awards, and (D) to the number and kind of securities subject to outstanding Awards and, if applicable, the grant or exercise price or Spread Value of outstanding Awards; and
(ii) if the Company or any subsidiary of the Company should merge or consolidate with, or purchase stock or assets or otherwise acquire the whole or part of the business of, another company, the Company in connection herewith, upon the recommendation of the Committee and the approval of the Board of Directors, (A) may assume, in whole or in part and with or without modification or conditions, any stock awards granted by the acquired company to its employees, in their capacity as such, or (B) may grant new Awards in substitution therefore; provided that the granting of an Award with the terms and conditions of the assumed or substitute Award is otherwise permissible under either this Plan or a plan approved by the shareholders of the acquired company. For the purposes of the preceding sentence, the permissibility of the granting of an option under a plan shall be determined as of the date of grant of the original option by the acquired company and not as of the date of assumption or substitution by the Company.
In connection with any of the events described in this Section 5(b), the Committee is also authorized to provide for the payment of any outstanding Awards in cash, including, but not limited to, payment of cash in lieu of any fractional Awards. In the event of any conflict between this Section 5(b) and other provisions of the Plan, the provisions of this section shall control. To the extent not prohibited by applicable laws, rules and regulations, any shares of Capital Stock underlying any assumed or substituted Awards as permitted above shall not be counted against the number of shares remaining for issuance with respect to Awards under Section 5(a).
6.Awards.
a. General. The types of Awards that may be granted under the Plan are set forth below. Awards may be granted singly, in combination or in tandem with other Awards.
i. Stock Options. A Stock Option represents the right to purchase a share of Stock at a predetermined grant price. The term of each Stock Option shall be set forth in the Award agreement, but no Stock Option shall be exercisable more than ten years after the grant date. The grant price per share of Capital Stock purchasable under a Stock Option shall not be less than 100% of the Fair Market Value on the date of grant. Subject to the applicable Award agreement, Stock Options may be exercised, in whole or in part, by giving written notice of exercise specifying the number of shares to be purchased. Such notice shall be accompanied by payment in full of the purchase price including taxes by certified or bank check or such other instrument as the Company may accept, including any shares of Capital Stock that are used by a Participant or withheld by the Company as full or partial payment of withholding or other taxes or as payment for the exercise or conversion price of an Award. Unless otherwise determined by the Committee, payment in full or in part may also be made in the form of Capital Stock already owned by the Participant or withheld by the Company valued at Fair Market Value. Except for a beneficiary designation as permitted by the terms of the applicable Award agreement or as designated by a Participant by will or as prescribed by the laws of descent and distribution, Stock Options may not be sold, assigned, encumbered, pledged or otherwise transferred. Dividends may not be accrued or paid with respect to Stock underlying an unexercised Stock Option.
ii. Restricted Stock. Shares of Restricted Stock are shares of Capital Stock that are awarded to a Participant and that during the Restricted Period may be forfeitable to the Company upon such conditions as may be set forth in the applicable Award agreement. Except for a beneficiary designation as permitted by the terms of the applicable Award agreement or as designated by a Participant by will or prescribed by the laws of descent and distribution, Restricted Stock may not be sold, assigned, encumbered, pledged or otherwise transferred during the Restricted Period. Except as provided in the applicable Award agreement, a Participant shall have with respect to such Restricted Stock all the rights of a holder of Capital Stock during the Restricted Period, including the right to dividends which may accrue during the Restricted Period.
A - 3
iii. Performance Share Units. Performance Share Units represent the right to receive shares of Capital Stock, cash, or both (as determined by the Committee) upon satisfaction of such conditions as may be set forth in the applicable Award agreement. Performance Share Units may not be sold, assigned, encumbered, pledged or otherwise transferred during the Restricted Period. Except as provided in the applicable Award agreement, a Participant shall have with respect to such Performance Share Units none of the rights of a holder of Capital Stock unless and until shares of Capital Stock are actually delivered in satisfaction of such Performance Share Units. To the extent specified in an Award agreement, dividend equivalents that would otherwise be payable during the Restricted Period on the underlying share equivalents may, however, accrue during the Restricted Period for payment thereafter if shares of Capital Stock are actually delivered in satisfaction of such Performance Share Units.
iv. Other Stock-Based Awards. Other Stock-Based Awards are Awards, other than Stock Options, Restricted Stock, or Performance Share Units that are denominated in, valued in whole or in part by reference to, or otherwise based on or related to, Capital Stock. The grant, purchase, exercise, exchange or conversion of Other Stock-Based Awards granted under this subsection (iv) shall be on such terms and conditions and by such methods as shall be specified by the Committee. Where the value of an Other Stock-Based Award is based on the Spread Value, the grant price for such an Award will not be less than 100% of the Fair Market Value on the date of grant.
b. Award Limitations. No individual non-employee board member shall be granted Awards (including any cancelled Awards) with respect to shares of Capital Stock valued at more than $500,000 during any calendar year, calculated based on the grant date value for financial reporting purposes.
c. Performance-Based Awards. Any Awards granted pursuant to the Plan may be in the form of performance-based Awards through the application of Performance Goals and Performance Cycles.
d. Stock Option Exercisability. Subject to Section 7, and unless otherwise provided by the Committee, the portion of a Stock Option which has not previously been exercised as of the effective time of a Participant’s termination of employment shall be forfeited immediately except where the employment of a Participant holding an unexercised Stock Option terminates because of resignation with the consent of the Committee (which consent may be given before or after resignation), retirement in accordance with the Company’s regular retirement policy, incapacity, or death. In such cases the term of the Stock Option shall be extended for a period of three months after the date of employment termination, during which period the Stock Option will continue to vest in accordance with its terms. Any portion of the Stock Option which is exercisable as of the end of such three-month period shall remain exercisable for an extended period ending 15 months after the date of such employment termination, but the Stock Option will not continue to vest during such extended period.
e. Approved Leave of Absence. Unless otherwise provided by the Committee, a Participant’s leave of absence for military or governmental service, or for other purposes approved by the Committee, shall not be deemed a Termination of Employment for purposes of the Plan, provided that any Stock Options held by such Participant may not be exercised during such leave of absence.
f. Minimum Vesting Period. The minimum vesting period of any Award issued shall be over a period of three (3) years, but in no event shall any portion of any Award vest in less than one year; provided that, the foregoing restrictions shall not apply (i) with respect to Awards granted covering up to 50,000 shares of Capital Stock, (ii) in the event of Termination of Employment due to death, incapacity or retirement, in which case Awards shall vest pro-rata, (iii) and as provided for in Section 7.
7.Awards. Upon a Change in Control, if a Participant has a Termination of Employment (i) for reasons other than Cause or (ii) for Good Reason (as defined in CIC Severance Plan) within 24 months after the effective date of a Change in Control, then all Stock Options held by such Participant as of the date of termination shall become fully vested and exercisable, and the restrictions and other conditions applicable to any Restricted Stock, Performance Share Units, or Other Stock-Based Awards held by such Participant as of the date of such Termination of Employment, including vesting requirements, shall lapse, and such Awards shall become free of all restrictions and fully vested. For this purpose, a “Change in Control” shall be as defined in the CIC Severance Plan. To the extent applicable, all such accelerated Awards shall be paid in accordance with the terms of the applicable Award agreement.
A - 4
9.Payments and Payment Deferrals. Payment of Awards may be in the form of cash, Capital Stock, other Awards or combinations thereof as the Committee shall determine, and with such restrictions as it may impose. To the extent an Award is not otherwise exempt from Code Section 409A, such Award shall be paid as soon as possible following the applicable triggering event as set forth herein but in no event later than March 15 of the year following such applicable triggering event. The Committee, either at the time of grant or by subsequent amendment, may require or permit deferral of the payment of Awards under such rules and procedures as it may establish; provided, however, that no such deferral of the payment of Awards shall occur unless permitted under Code Section 409A and the regulations issued thereunder. It also may provide that deferred settlements include the payment or crediting of interest or other earnings on the deferred amounts, or the payment or crediting of dividend equivalents where the deferred amounts are denominated in Capital Stock equivalents.
10.Award Agreements. Each Award under the Plan shall be evidenced by a written agreement in a form prescribed by the Committee that sets forth the terms, conditions and limitations for each Award. Such terms may include, but are not limited to, the term of the Award, vesting and forfeiture provisions, and the provisions applicable in the event the Participant’s employment terminates. The Committee may amend an Award agreement, provided that, except as set forth in any Award agreement or as necessary to comply with applicable law or avoid adverse tax consequences to some or all Plan Participants, no such amendment may materially and adversely affect an Award without the Participant’s consent.
11.Unfunded Status of Plan. It is presently intended that the Plan constitute an “unfunded” plan for incentive and deferred compensation. The Committee may authorize the creation of trusts or other arrangements to meet the obligations created under the Plan to deliver Capital Stock or make payments; provided, however, that, unless the Committee otherwise determines, the existence of such trusts or other arrangements is consistent with the “unfunded” status of the Plan.
12.Code Section 409A. Awards under the Plan are intended to satisfy the requirements for exclusion from Code Section 409A and the regulations issued thereunder so as to avoid the imposition of any additional taxes or penalties under Code Section 409A. Accordingly, notwithstanding anything to the contrary contained in the Plan or any Award Agreement, neither the Board nor the Committee shall not take any action or exercise any discretion otherwise authorized under the Plan or any Award Agreement if such action or exercise of discretion would cause any Awards to become subject to the requirements of Section 409A of the Code. If the Board or Committee determines that an Award, Award agreement, payment, or any other action contemplated by the provisions of the Plan would, if undertaken, cause a Participant to become subject to any additional taxes or other penalties under Code Section 409A, then unless the Board or Committee specifically provides otherwise, such Award, Award agreement, payment or other action shall not be given effect to the extent it causes such result and the related provisions of the Plan and/or Award Agreement may be modified by the Board or Committee, or, if necessary, suspended to the extent determined appropriate by the Board or Committee, in each case without the consent of or notice to the Participant in order to comply with the requirements of Code Section 409A. To the extent any provision in the Plan or Award agreement purports to give the Board or Committee discretion to modify the terms of an Award, and the mere possession (as opposed to the exercise) of such discretion would result in adverse tax consequences to any Participant, then the Board or Committee shall not have such discretion.
A - 5
13.General Provisions.
a. Investment Representations. The Committee may require each person acquiring shares of Capital Stock pursuant to an Award to represent to and agree with the Company in writing that such person is acquiring the shares for investment and not with a view to the distribution thereof. The certificates for such shares may include any legend that the Committee deems appropriate to reflect any restrictions on transfer.
b. Not an Employment Obligation. Neither the adoption of the Plan nor the granting of Awards under the Plan shall confer upon any Key Employee any right to continued employment nor shall they interfere in any way with the right of the Company, a subsidiary or an affiliate to terminate the employment of any Key Employee at any time.
c. Income Tax Withholding. No later than the date as of which an amount first becomes includable in the gross income of the Participant for income tax purposes with respect to any Award under the Plan, the Participant shall pay to the Company, or make arrangements satisfactory to the Company regarding the payment of, any federal, state, local or foreign taxes of any kind that are required by law or applicable regulation to be withheld with respect to such amount. Unless otherwise determined by the Committee, withholding obligations arising from an Award may be settled with Capital Stock, including Capital Stock that is part of, or is received upon exercise or conversion of, the Award that gives rise to the withholding requirement, in order to satisfy up to the lesser of: (i) the maximum statutory rate in the Participant’s applicable jurisdiction or (ii) the amount required by applicable tax laws and jurisdictions. The obligations of the Company under the Plan shall be conditional on such payment or arrangements, and the Company, its subsidiaries and its affiliates shall, to the extent permitted by law, have the right to deduct any such taxes from any payment otherwise due to the Participant. The Committee may establish such procedures as it deems appropriate, including the making of irrevocable elections, for the settling of withholding obligations with Capital Stock.
d. Dodd-Frank Compliance. The Company is required under applicable provisions of the Dodd-Frank Wall Street Reform and Consumer Protection Act of 2010 and Exchange Act Section 10D to adopt and maintain a policy, applicable in the event of an accounting restatement by the Company due to any material noncompliance of the Company with any financial reporting requirement under applicable securities laws, requiring the Company to recover or “clawback” amounts of incentive-based compensation paid to its current or former executive officers to the extent such amounts exceed the compensation that would have been received from the Company after giving effect to the restatement. Participants who are executive officers of the Company shall be bound by any clawback policy adopted by the Company pursuant to Dodd-Frank, Exchange Act Section 10D, or any regulations of the Securities and Exchange Commission promulgated thereunder, or otherwise adopted by the Company.
e. Governing Law. The Plan and all Awards made and actions taken there under shall be governed by and construed in accordance with the laws of the State of Delaware, excluding any conflicts or choice of law, rule or principle that might otherwise refer construction or interpretation of the Plan to the substantive law of another jurisdiction. Unless otherwise provided in an Award, recipients of an Award under the Plan are deemed to submit to the exclusive jurisdiction and venue of the federal or state courts of Delaware, to resolve any and all issues that may arise out of or relate to the Plan or any related Award.
f. Severability. If any provision of the Plan is held invalid or unenforceable, the invalidity or unenforceability shall not affect the remaining parts of the Plan, and the Plan shall be enforced and construed as if such provision had not been included.
g. Successors and Assigns. All obligations of the Company under the Plan with respect to Awards granted hereunder shall be binding on any successor to the Company, whether the existence of such successor is the result of a direct or indirect purchase, merger, consolidation, or otherwise, of all or substantially all of the business and/or assets of the Company.
h.Effective Date; Plan Expiration. If approved by the Company’s stockholders, the Plan shall become effective on May 16, 2022. Except as otherwise provided by the Board, no Awards shall be made after May 16, 2032, provided that any Awards granted prior to that date may extend beyond it.
A - 6